Stock Market Outlook For The Week of
July 22nd = Uptrend
INDICATORS
20/50 Day Moving Averages: Uptrend
Price & Volume Action: Uptrend
Objective Elliott Wave Analysis: Uptrend
U.S. stocks remained above recent resistance levels, reaffirming the uptrend. So it's still game on for buying risk assets. Earnings season kicked off last week, and Q2 GDP estimates are due this week. 10-year treasuries regained their 50-day moving average, while gold and commodities remain in a downtrend.
All the indexes start the week above their 20 and 50 day moving averages.
2018-07-22 - US Stock Market Averages
We saw some higher volume selling last week (Thursday), but the signal remains in an uptrend.
OEW remains in an uptrend, and the 3000 S&P price target (~6% from the current price level) is back in play.
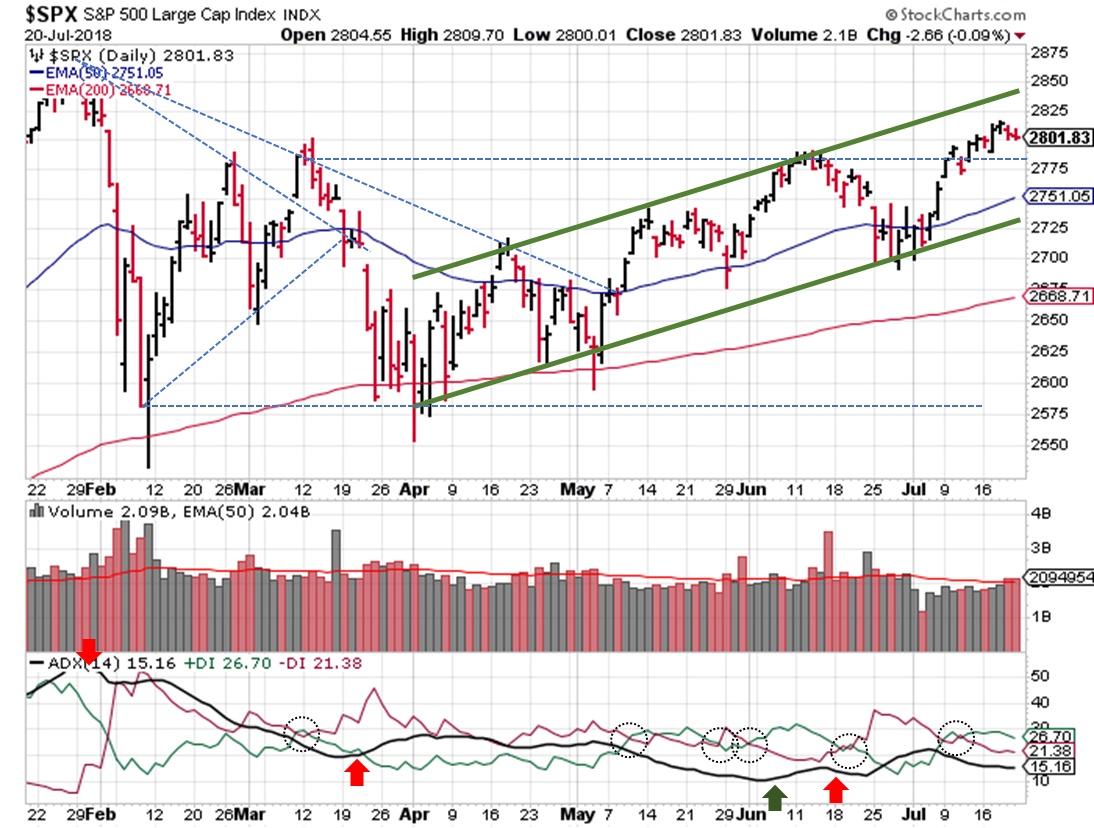
2018-07-22 - SPX Technical Analysis - Daily
Technically speaking, the S&P ($SPX) meandered around last week and didn't move much in either direction. Prices stayed above the 2787 support level and within the current upward price channel.
As for the ADX, the reading remains below 20, but at least the signal remains bullish.
If you find this research helpful, please tell a friend. If you don't find it helpful, tell an enemy. I share articles and other news of interest via Twitter; you can follow me @investsafely. The weekly market outlook is also posted on Facebook and Linkedin.
You can check out how well (or poorly) the outlook has performed as a stand-alone, signal generator using past performance estimates:
- 2015 Performance - Stock Market Outlook
- 2016 Performance - Stock Market Outlook
- 2017 Performance - Stock Market Outlook
For the detailed Elliott Wave Analysis, go to the ELLIOTT WAVE lives on by Tony Caldaro. Charts provided courtesy of stockcharts.com.
Return from Stock Market Outlook 2018-07-22 to Tracking the Stock Market
Return to Invest-Safely.com


No comments:
Post a Comment