Stock Market Outlook For The Week of
January 27th = Uptrend
INDICATORS
20/50 Day Moving Averages: Uptrend
Price & Volume Action: Uptrend
Objective Elliott Wave Analysis: Uptrend

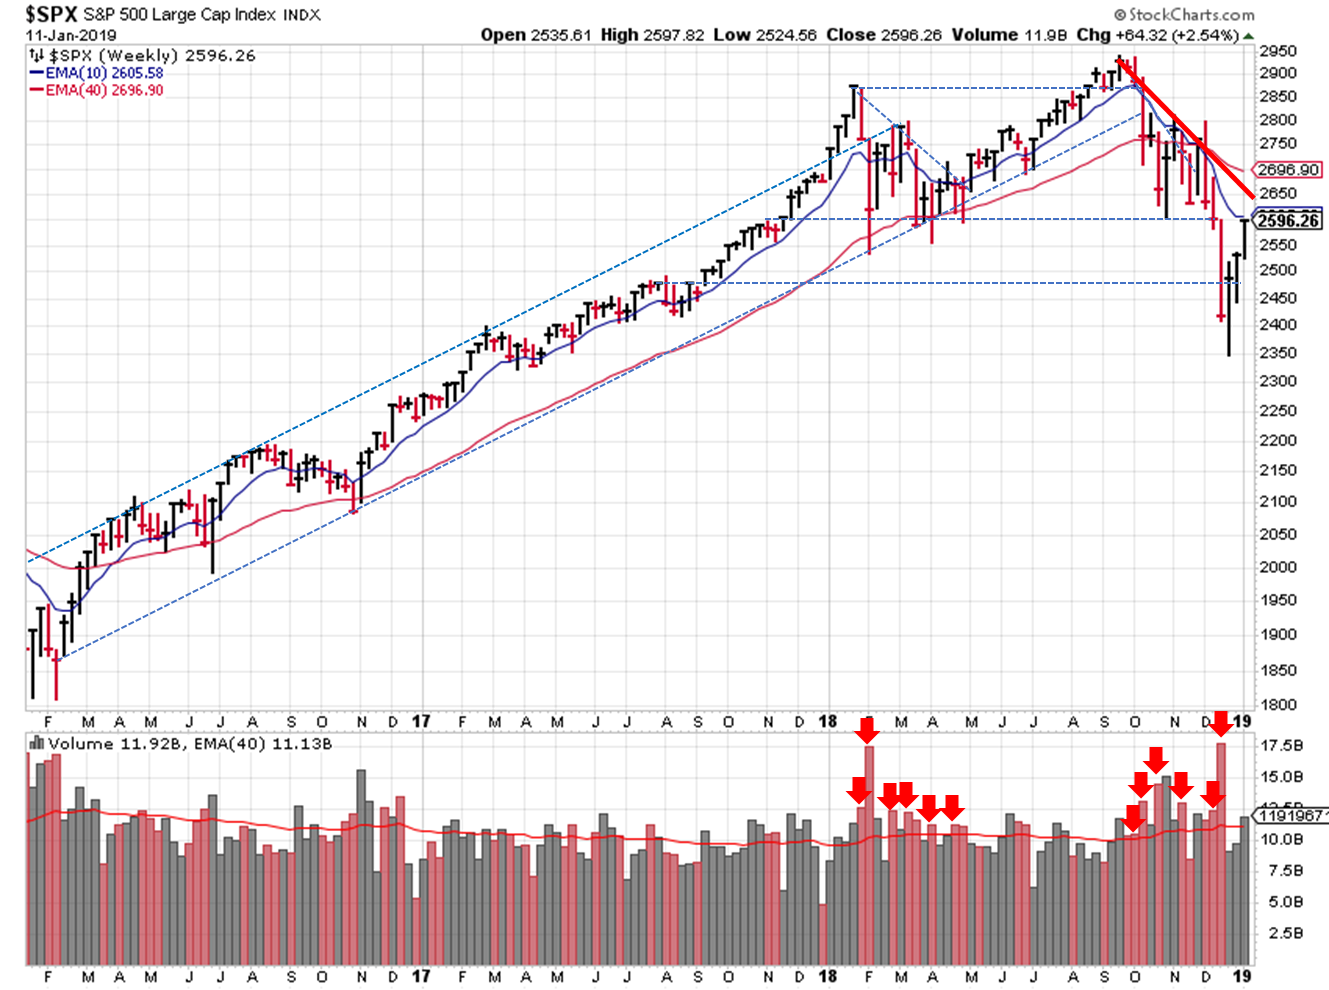
2019-01-27 - SPX Trendline Analysis - Weekly
In fact, the S&P appears to have closed below the recent uptrend line; without a real "lower high" closing price, the uptrend was always tentative. So there's a small chance that the Q4 downtrend isn't complete.
Switching to the near-term, the S&P ($SPX) found support at the 50-day moving average, but couldn't sustain the pace its uptrend, as mentioned above. And prices still haven't broken the 2018 Q4 downtrend line.

2019-01-27 - SPX Trendline Analysis - Daily
The DI+ / DI- continues to signal a bullish environment. As mentioned last week, we haven't seen a lower weekly close in some time. I could imagine a scenario where prices meet resistance at the 2018 Q4 downtrend and lose some ground before establishing a real uptrend and moving higher the rest of Q1.
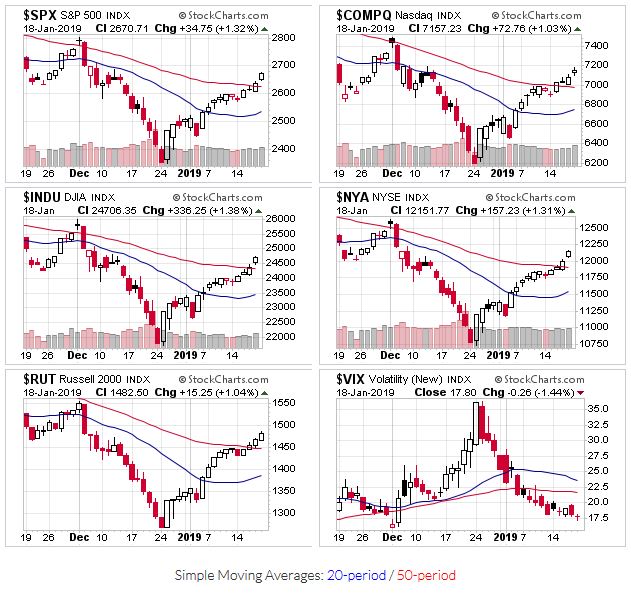
2018-01-20 - US Stock Market Averages
The averages start the week above their 50 day moving averages. Price and volume also looks positive, as the S&P hasn't seen a distribution day since early January. And finally, OEW puts the probability of an uptrend at 80% this week, and odds of a bull market at 50%.
On the plus side, any extension of the Q4 downtrend or signal change is likely a buy the dip opportunity. And no whipsaw last week!
If you find this research helpful, please tell a friend. If you don't find it helpful, tell an enemy. I share articles and other news of interest via Twitter; you can follow me @investsafely. The weekly market outlook is also posted on Facebook and Linkedin.
Once a year, I review the market outlook signals as if they were a mechanical trading system, while pointing out issues and making adjustments. The goal is to provide an example of how to analyze and continuously improve a trading system.
- 2015 Performance - Stock Market Outlook
- 2016 Performance - Stock Market Outlook
- 2017 Performance - Stock Market Outlook
For the detailed Elliott Wave Analysis, go to the ELLIOTT WAVE lives on by Tony Caldaro. Charts provided courtesy of stockcharts.com.