Sunday, November 25, 2018

Weekend Stock Market Outlook

Stock Market Outlook For The Week of
November 25th = Downtrend

INDICATORS

20/50 Day Moving Averages: Downtrend
Price & Volume Action: Downtrend
Objective Elliott Wave Analysis: Downtrend

COMMENTARY

Investors didn't display much holiday cheer during the short trading week in the US. So much for my thought that we'd head back to the 50-day moving average last week...just another example of why it's so important to stick with clearly defined buy and sell rules.

All the indexes start the week back below their 20 and 50 day moving averages.

Price charts for $SPX,$COMPQ,$INDU,$NYA,$RUT,$VIX,$TNX,$USD,$CRB,$GOLD

2018-11-25- US Stock Market Averages

The price/volume signal switches to a mixed signal The price/volume signal switches to a downtrend signal after taking out the October lows. As mentioned last week, it wasn't a strong uptrend to begin with, so a change isn't so surprising.

OEW is back to a downtrend, as the uptrend within the overall downtrend appears to have completed already (versus last week's statement that a rally to +2800 was in the cards).

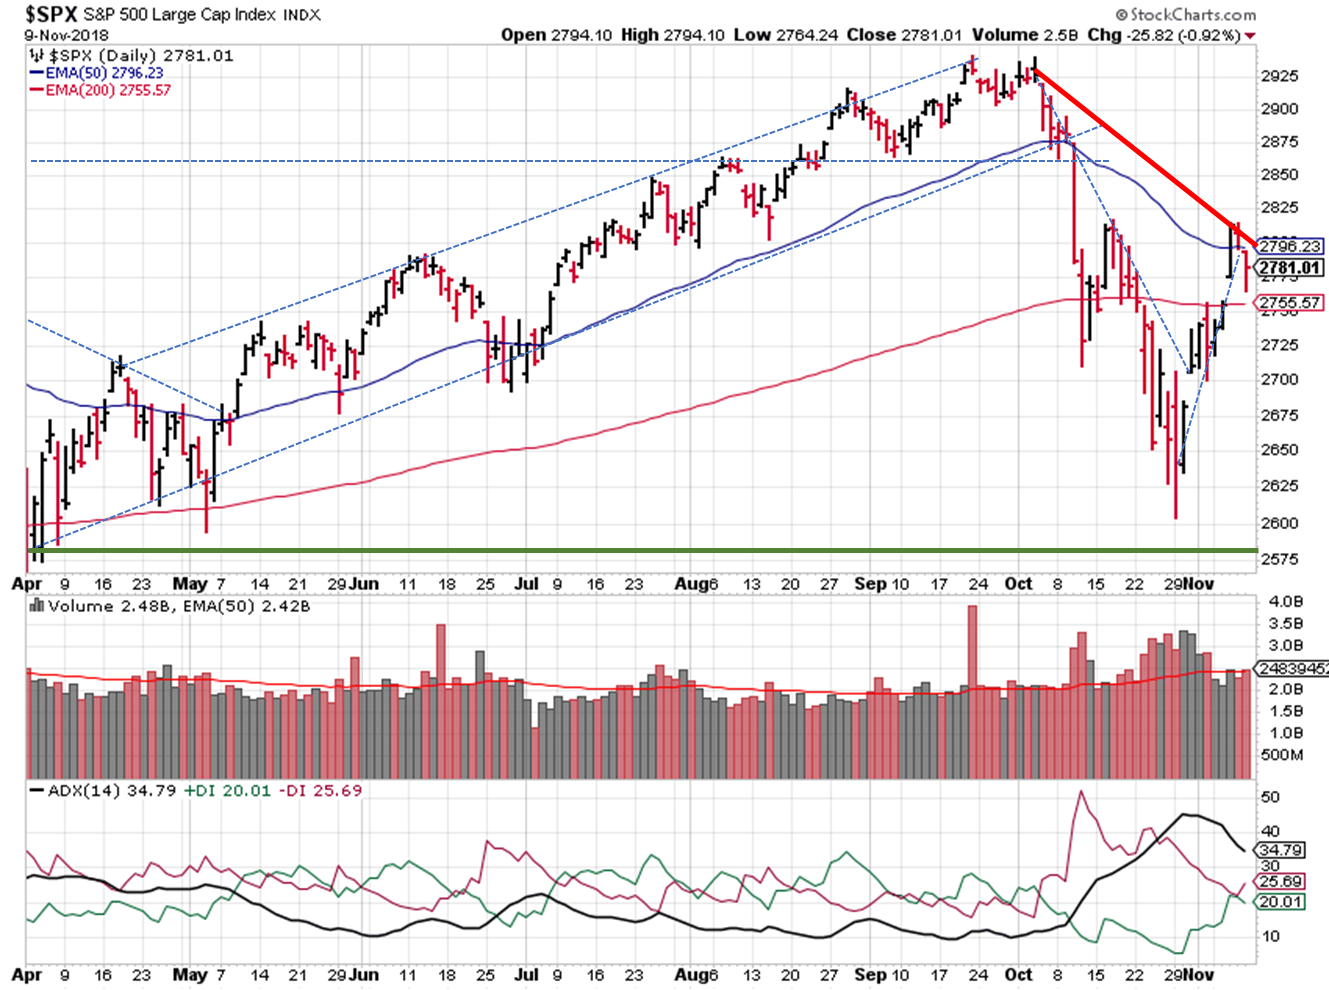
The S&P ($SPX) gapped down last week, breaking through a fledgling trendline and eventually closing out the week below the October low. The closing price wasn't too far way from that mark, so support around 2640 is still a possibility.

2018-11-25 - $SPX Technical Analysis - Daily

2018-11-25 - SPX Technical Analysis - Daily

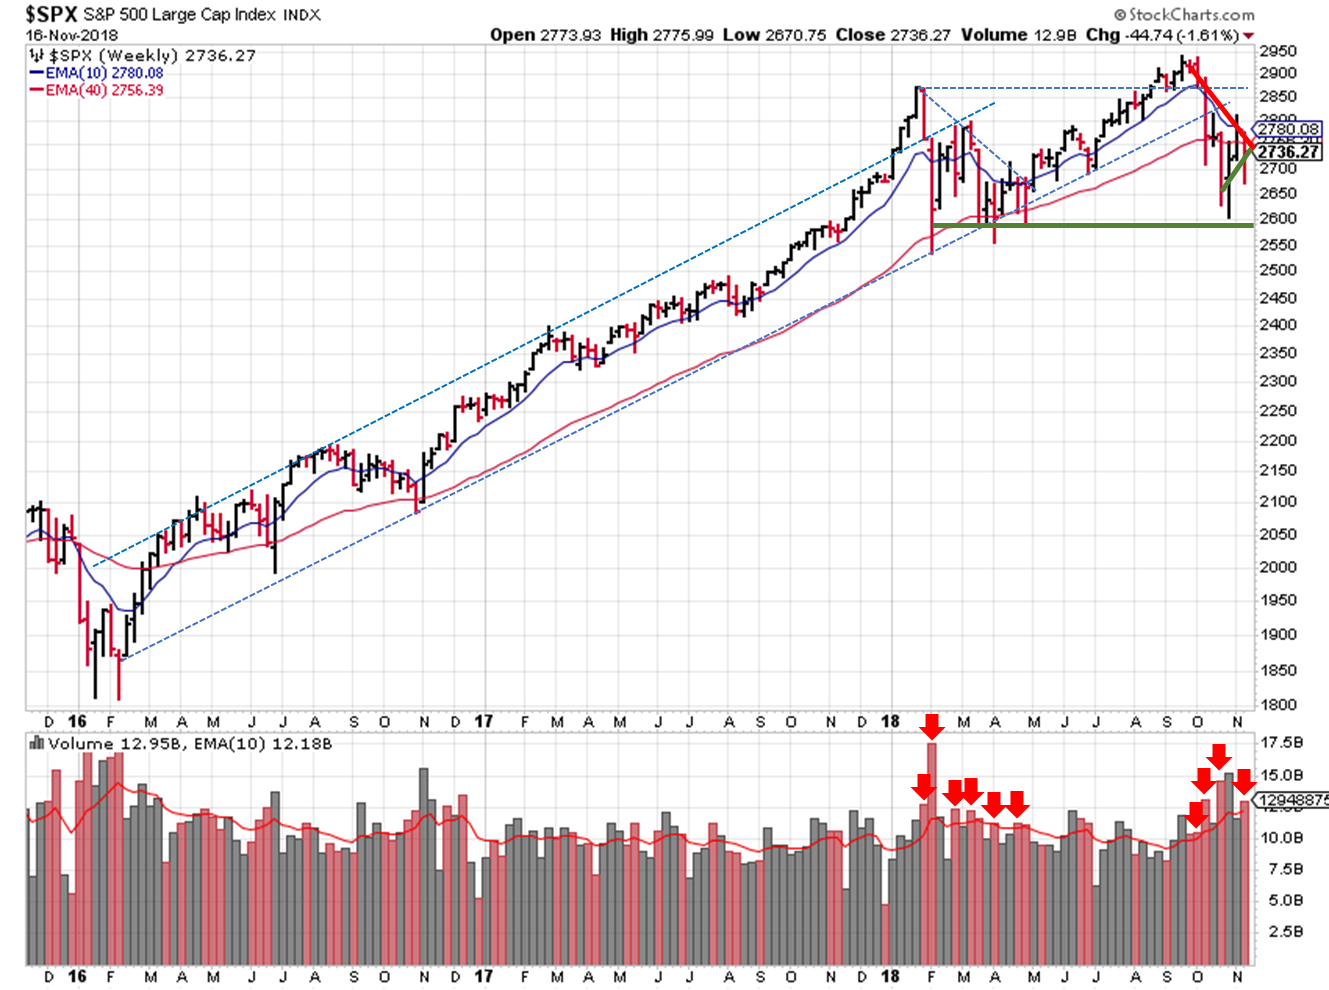
In the weekly view, the S&P confirmed the downtrend last week.

2018-11-25 - $SPX Technical Analysis - Weekly

2018-11-25 - SPX Technical Analysis - Weekly

Hopefully you stayed conservative last week and enjoyed some Thanksgiving feasting.

Participate. Protect. Prepare.


If you find this research helpful, please tell a friend. If you don't find it helpful, tell an enemy. I share articles and other news of interest via Twitter; you can follow me @investsafely. The weekly market outlook is also posted on Facebook and Linkedin.

You can check out how well (or poorly) the outlook has performed as a stand-alone, signal generator using past performance estimates:

For the detailed Elliott Wave Analysis, go to the ELLIOTT WAVE lives on by Tony Caldaro. Charts provided courtesy of stockcharts.com.


  1. Invest-Safely.com
  2. >>
  3. Tracking the Stock Market
  4. >>
  5. Stock Market Outlook for 2018-11-25

Sunday, November 18, 2018

Weekend Stock Market Outlook

Stock Market Outlook For The Week of
November 18th = Downtrend

INDICATORS

20/50 Day Moving Averages: Downtrend
Price & Volume Action: Mixed
Objective Elliott Wave Analysis: Mixed

COMMENTARY

A difficult week to judge. In the end, preserving capital is key and caution is the name of the game right now.

This week starts with major indexes back below their 50-day moving averages. Most fell below their 20-day moving averages last week as well, but were able to recover by the close on Friday... the lone exception being the NASDAQ.

Price charts for $SPX,$COMPQ,$INDU,$NYA,$RUT,$VIX,$TNX,$USD,$CRB,$GOLD

2018-11-18- US Stock Market Averages

The price/volume signal switches to a mixed signal because we picked up a couple distribution days and we weren't able to hold a key moving averages (200 day). Neither of which is what you want to see early in an uptrend. Also, the best performing stocks aren't exactly "growth stocks" (car parts, retail, drug stores).

OEW indicates an uptrend within the overall downtrend. So far, OEWs expectation for a sell off to ~2,700 was the right call, as prices found support at that level on Wednesday and Thursday. If the analysis holds, a rally to +2800 will follow over the next few weeks, before we fall again towards 2,400.

The S&P ($SPX) couldn't hold its 200 day moving average, and retreated last week. In the process, it "filled" both gap ups in the recent uptrend. There was price support around ~2,700, as OEW expected.

2018-11-18 - $SPX Technical Analysis - Daily

2018-11-18 - SPX Technical Analysis - Daily

Looking at the long-term picture, the S&P should confirm the uptrend or downtrend this week...unless it moves completely sideways and closes at the same price as last week.

2018-11-18 - $SPX Technical Analysis - Weekly

2018-11-18 - SPX Technical Analysis - Weekly

To summarize, the moving averages didn't provide much support last week, so the downtrend signal remains in place. The price/volume indicator shifted to from uptrend to mixed. OEW is still mixed, but shows a short-term uptrend within the overall downtrend. You could argue that the price/volume indicator has an uptrend bias since it hasn't shown an outright downtrend yet. And OEW could be interpreted as an uptrend for the near term. This interpretation would show 2 of the 3 signals in uptrend mode, and initiate a trend change.

So what to do? My expectation is that we rally higher from here. We may even get back above the 50-day moving average, which would shift the overall signal back to an uptrend...albeit missing out on a ~2% price increase. The characteristics of the market are different (volatility, etc.), so you need to make sure your signals are appropriate. Keep your losses small, and don't be in a hurry to initiate large positions.

Participate. Protect. Prepare.


If you find this research helpful, please tell a friend. If you don't find it helpful, tell an enemy. I share articles and other news of interest via Twitter; you can follow me @investsafely. The weekly market outlook is also posted on Facebook and Linkedin.

You can check out how well (or poorly) the outlook has performed as a stand-alone, signal generator using past performance estimates:

For the detailed Elliott Wave Analysis, go to the ELLIOTT WAVE lives on by Tony Caldaro. Charts provided courtesy of stockcharts.com.


  1. Invest-Safely.com
  2. >>
  3. Tracking the Stock Market
  4. >>
  5. Stock Market Outlook for 2018-11-18

Sunday, November 11, 2018

Weekend Stock Market Outlook

Stock Market Outlook For The Week of
November 11th = Downtrend

INDICATORS

20/50 Day Moving Averages: Downtrend
Price & Volume Action: Uptrend
Objective Elliott Wave Analysis: Mixed

COMMENTARY

Investors like the results of mid-term elections in the US. No political party in total control usually results in gridlock, which mean businesses focus on business. Investors didn't like the outcome from the Fed meeting as much, with likely rate increase in December and expectations for 3 more in 2019.

With the exception of the Dow Jones Industrials, all the indexes continue to trade below their 20 and 50 day moving averages, so no signal change yet.

Price charts for $SPX,$COMPQ,$INDU,$NYA,$RUT,$VIX,$TNX,$USD,$CRB,$GOLD

2018-11-11- US Stock Market Averages

The price/volume signal confirmed an uptrend last week as the indexes jumped back above their 200 day moving averages. Trading volume wasn't REALLY great and we're still below the 50-day moving averages for the most part. So it appears to be more of a recovery rally after the fierce selling, reminiscent of earlier this year, rather than a new bull market.

OEW called for a probable uptrend, within the overall downtrend. The expectation is for the S&P to sell off a bit to ~2,700, rally higher, then fall again towards 2,400.

The S&P ($SPX) cleared the 200 day moving average, but then ran into resistance around 2800.

2018-11-11 - $SPX Technical Analysis - Daily

2018-11-11 - SPX Technical Analysis - Daily

Again, use your process to determine what and when to buy or sell. Participate. Protect. Prepare.


If you find this research helpful, please tell a friend. If you don't find it helpful, tell an enemy. I share articles and other news of interest via Twitter; you can follow me @investsafely. The weekly market outlook is also posted on Facebook and Linkedin.

You can check out how well (or poorly) the outlook has performed as a stand-alone, signal generator using past performance estimates:

For the detailed Elliott Wave Analysis, go to the ELLIOTT WAVE lives on by Tony Caldaro. Charts provided courtesy of stockcharts.com.


  1. Invest-Safely.com
  2. >>
  3. Tracking the Stock Market
  4. >>
  5. Stock Market Outlook for 2018-11-11

Sunday, November 4, 2018

Weekend Stock Market Outlook

Stock Market Outlook For The Week of
November 4th = Downtrend

INDICATORS

20/50 Day Moving Averages: Downtrend
Price & Volume Action: Downtrend
Objective Elliott Wave Analysis: Downtrend

COMMENTARY

Prices for U.S. stocks bounced and indexes finished up for the week. With midterm elections Tuesday, it's anyone's guess how market prices will respond with the votes are tallied. And we have a Fed meeting this week.

All the indexes continue to trade at or below their 20 and 50 day moving averages, keeping this signal in a downtrend.

Price charts for $SPX,$COMPQ,$INDU,$NYA,$RUT,$VIX,$TNX,$USD,$CRB,$GOLD

2018-11-04 - US Stock Market Averages

The price/volume signal remains in a downtrend. Now that the indexes have rallied a bit, start looking for a follow-through day (1.5% gain on higher than average trading volume), which would change this signal back to an uptrend. Thursday was close, but couldn't pull through.

OEW maintains a downtrend signal, but:

    "the decline from SPX 2941 to 2604 might have ended the first downtrend...and a potential...uptrend is now underway."

The S&P ($SPX) appears to have bottomed just above 2600. On Friday, prices tested the 200 day moving average.

2018-11-04 - $SPX Technical Analysis - Daily

2018-11-04 - SPX Technical Analysis - Daily

Last week we mentioned a change in the character of the market, in terms of volatility. I received an email asking how to visualize that "change". Many people use the VIX (see above). But if you're looking for something more specific to the index or stock you're following, try the Average True Range indicator; I actually calculate within one of my mechanical trading systems.

2018-11-04 - $SPX Technical Analysis - Weekly

2018-11-04 - SPX Technical Analysis - Weekly

My opinion is still that the SPX will test support around 2581, but now it appears it will claw back some of the decline first. We could even see 2875 before selling off again. I imagine the price action could look similar to what occurred between the February and April lows.

Again, use your process to determine what and when to buy or sell. Per OEW:

    "...the four major US indices have not confirmed bear markets yet. We may not see a bear market confirmation in the US until the bear market is nearly over. That’s what happened in 2016, and is part of the reason we were caught off guard at that low."

Participate. Protect. Prepare.


If you find this research helpful, please tell a friend. If you don't find it helpful, tell an enemy. I share articles and other news of interest via Twitter; you can follow me @investsafely. The weekly market outlook is also posted on Facebook and Linkedin.

You can check out how well (or poorly) the outlook has performed as a stand-alone, signal generator using past performance estimates:

For the detailed Elliott Wave Analysis, go to the ELLIOTT WAVE lives on by Tony Caldaro. Charts provided courtesy of stockcharts.com.


  1. Invest-Safely.com
  2. >>
  3. Tracking the Stock Market
  4. >>
  5. Stock Market Outlook for 2018-11-04