Stock Market Outlook For The Week of
February 10th = Uptrend
INDICATORS
ADX Directional Indicators: Uptrend
Price & Volume Action: Uptrend
Objective Elliott Wave Analysis: Uptrend
COMMENTARY
The stock markets took a breather last week. Earnings season has been a mixed bag. In some cases, future guidance was more important than beating expectations.
The 2018 performance review posted during the week; you can check it out here. The biggest change, from a weekly post perspective, is the switch from 50-day moving averages to the ADX directional indicator.
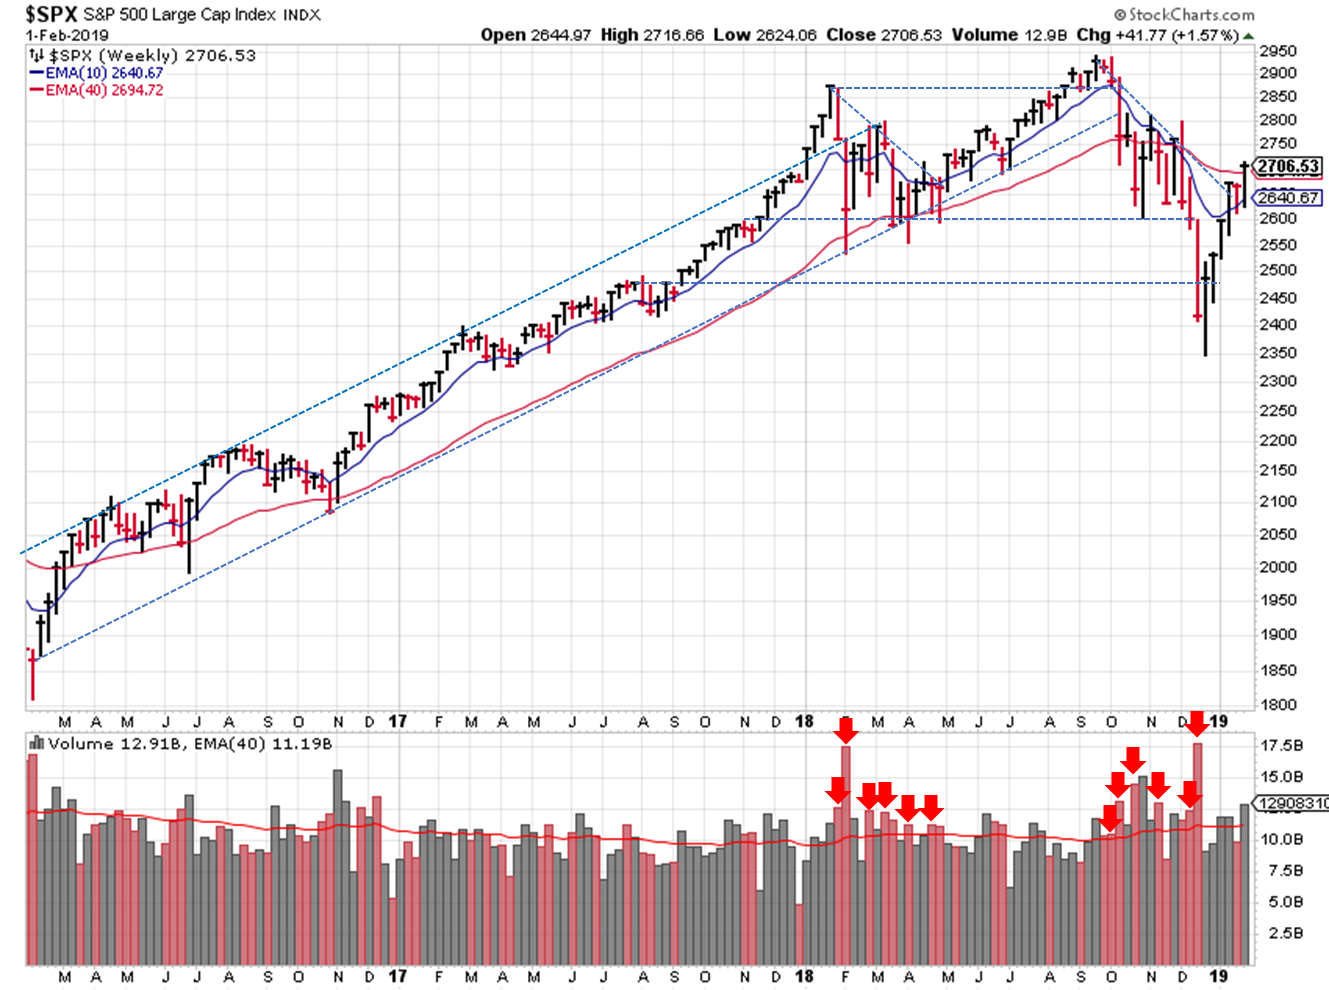
In the weekly view, the S&P ($SPX) basically ended where it started after running into resistance at the 200-day / 40-week moving average. Even though it didn't close at the highs for the first time in several weeks, there still isn't a higher "low" to use for drawing the new uptrend.

2019-02-10 - SPX Trendline Analysis - Weekly
Switching to a daily view, the bounce lower from the 200-day moving average broke the tentative uptrend I had drawn. Now we wait for signs of support...I'd guess the mid-2600's...or the 50-day moving average by the time prices get there.

2019-02-10 - SPX Trendline Analysis - Daily
The DI+ / DI- continues to show a bullish environment. In support of the signal adjustments made in the 2018 performance review, the DI cross-overs (uptrend/downtrend signals) are now overlaid on the daily chart.
No change in price/volume; still in rally mode (above the 50 day moving average, limited institutional selling). OEW also remains in uptrend mode.

2018-02-10 - US Stock Market Averages
The U.S. stock markets have made an impressive bounce off the late December low, so a brief pause / consolidation is a good thing...fingers crossed this uptrend/rally isn't just a big bull trap!
Participate. Protect. Prepare.
If you find this research helpful, please tell a friend. If you don't find it helpful, tell an enemy. I share articles and other news of interest via Twitter; you can follow me
@investsafely. The weekly market outlook is also posted on
Facebook and
Linkedin.
Charts provided courtesy of stockcharts.com.
If you're interested in learning more about the relationship between price and volume, or how to find and trade the best stocks for your growth strategy, check out this book on Amazon via the following affiliate link: How to Make Money in Stocks: A Winning System in Good Times and Bad. It's one of my favorites.
For the detailed Elliott Wave Analysis, go to the ELLIOTT WAVE lives on by Tony Caldaro.
Once a year, I review the market outlook signals as if they were a mechanical trading system, while pointing out issues and making adjustments. The goal is to give you to give you an example of how to analyze and continuously improve your own systems.
IMPORTANT DISCLOSURE INFORMATION
This material is for general communication and is provided for informational and/or educational purposes only. None of the content should be viewed as a suggestion that you take or refrain from taking any action nor as a recommendation for any specific investment product, strategy, or other such purpose. Certain information contained herein has been obtained from third-party sources believed to be reliable, but we cannot guarantee its accuracy or completeness.
To the extent that a reader has any questions regarding the applicability of any specific issue discussed above to his/her individual situation, he/she is encouraged to consult with the professional advisors of his/her choosing. Invest Safely, LLC is not a law firm, certified public accounting firm, or registered investment advisor and no portion of its content should be construed as legal, accounting, or investment advice.
The material is not to be construed as an offer or a recommendation to buy or sell a security nor is it to be construed as investment advice. Additionally, the material accessible through this website does not constitute a representation that the investments described herein are suitable or appropriate for any person.
Hypothetical Presentations:
Any referenced performance is “as calculated” using the referenced funds and has not been independently verified. This presentation does not discuss, directly or indirectly, the amount of the profits or losses, realized or unrealized, by any reader or contributor, from any specific funds or securities.
The author and/or any reader may have experienced materially different performance based upon various factors during the corresponding time periods. To the extent that any portion of the content reflects hypothetical results that were achieved by means of the retroactive application of a back-tested model, such results have inherent limitations, including:
Model results do not reflect the results of actual trading using assets, but were achieved by means of the retroactive application of the referenced models, certain aspects of which may have been designed with the benefit of hindsight
Back-tested performance may not reflect the impact that any material market or economic factors might have had on the use of a trading model if the model had been used during the period to actually manage assets
Actual investment results during the corresponding time periods may have been materially different from those portrayed in the model
Past performance may not be indicative of future results. Therefore, no one should assume that future performance will be profitable, or equal to any corresponding historical index.
The S&P 500 Composite Total Return Index (the "S&P") is a market capitalization-weighted index of 500 widely held stocks often used as a proxy for the stock market. Standard & Poor's chooses the member companies for the S&P based on market size, liquidity, and industry group representation. Included are the common stocks of industrial, financial, utility, and transportation companies. The S&P is not an index into which an investor can directly invest. The historical S&P performance results (and those of all other indices) are provided exclusively for comparison purposes only, so as to provide general comparative information to assist an individual in determining whether the performance of a specific portfolio or model meets, or continues to meet investment objective(s). The model and indices performance results do not reflect the impact of taxes.
Investing involves risk (even the “safe” kind)! Past performance does not guarantee or indicate future results. Different types of investments involve varying degrees of underlying risk. Therefore, do not assume that future performance of any specific investment or investment strategy be suitable for your portfolio or individual situation, will be profitable, equal any historical performance level(s), or prove successful (including the investments and/or investment strategies describe on this site).
-
Invest-Safely.com
>>
-
Tracking the Stock Market
>>
-
Stock Market Outlook for 2018-02-10