Sunday, September 30, 2018

Weekend Stock Market Outlook

Stock Market Outlook For The Week of
September 30th = Uptrend

INDICATORS

20/50 Day Moving Averages: Uptrend
Price & Volume Action: Uptrend
Objective Elliott Wave Analysis: Uptrend

COMMENTARY

The 3rd quarter comes to a close and we still have an uptrend signal. Hopefully the good times continue through Q4!

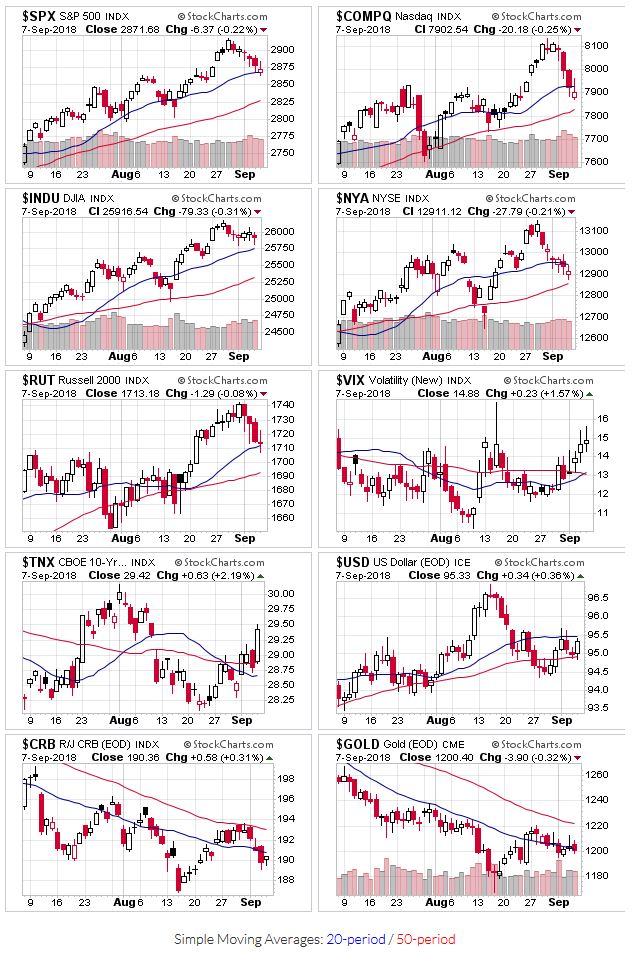
With the exception of the Russell 2000, all the major market averages continue to trade above their 20 and 50 day moving averages. The R2K trended lower the entire month of September, which is a bit worrisome considering it's the "small cap" index and small caps tend to lead bull markets.

Price charts for $SPX,$COMPQ,$INDU,$NYA,$RUT,$VIX,$TNX,$USD,$CRB,$GOLD

2018-09-30 - US Stock Market Averages

Some distribution last week, so the level of institutional selling is still elevated. No change in the signal this week, but trading volume and distribution days are another thing to keep your eye on going forward.

OEW remains in an uptrend to start the week. Longer term, OEW sees the current bull market at a turning point, and commentary has started to focus on the next correction. Adding on to last week's comment about caution, Tony says:

    While our target all along has been SPX 3000+ by 2018+, and it still may get there, we’re not one to try and pick the exact top. We scale in when we think a bull market is underway, and scale out when we think it is close to ending.

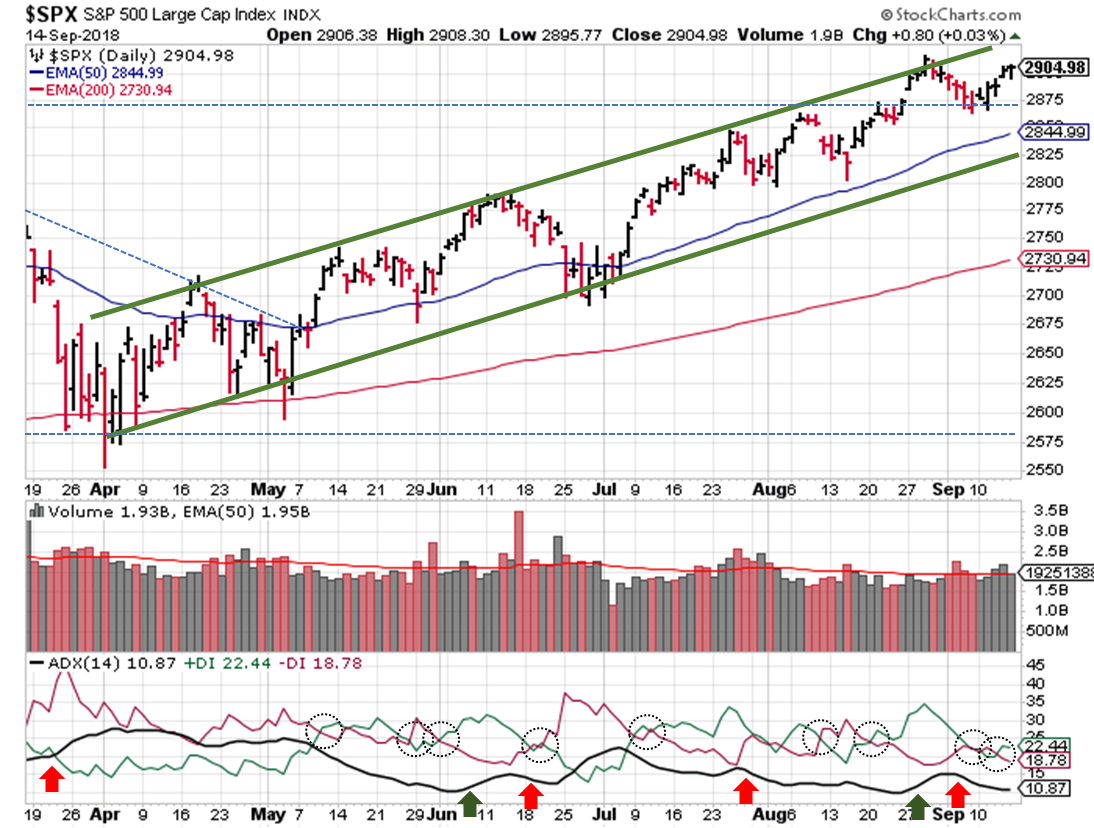
Moving onto our technical analysis, as expected, the S&P ($SPX) retreating after reaching the upper channel. We start this week closer to the mid-way point, but prices still haven't tested the January high, so look for that level for support if we continue lower this week.

2018-09-30 - $SPX Technical Analysis - Daily

2018-09-30 - SPX Technical Analysis - Daily

The ADX fell last week, putting it back to recent lows. The DI+/- are roughly equal as well. No clear direction from that indicator for this week. The longer-term view remains the same and supports the case for an uptrend; trading volume returning and the January high supporting.

2018-09-30 - $SPX Technical Analysis - Weekly

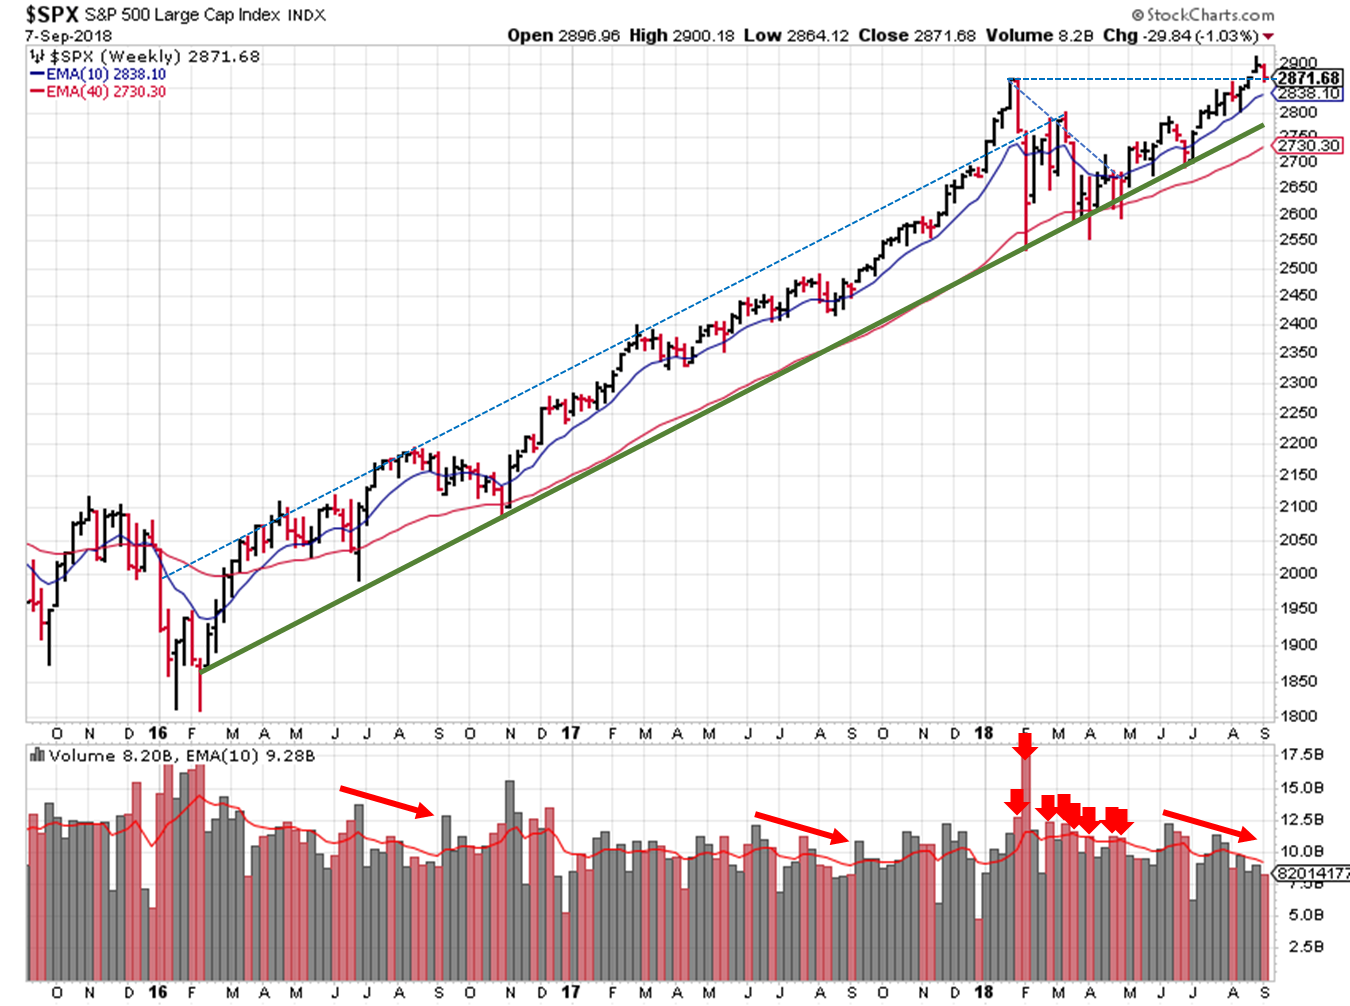
2018-09-30 - SPX Technical Analysis - Weekly

With Q3 earnings still a few weeks out, I don't see many upside catalysts. In fact, the trade war / tariff chatter may be just the thing to take us down a notch or two (the January high just below 2900 for the S&P or the 50-day) as discussed last week. It's not time to sell the farm, so to speak, but consider trimming winners and taking profits from any trades you initiated back when this uptrend started in March/April.


If you find this research helpful, please tell a friend. If you don't find it helpful, tell an enemy. I share articles and other news of interest via Twitter; you can follow me @investsafely. The weekly market outlook is also posted on Facebook and Linkedin.

You can check out how well (or poorly) the outlook has performed as a stand-alone, signal generator using past performance estimates:

For the detailed Elliott Wave Analysis, go to the ELLIOTT WAVE lives on by Tony Caldaro. Charts provided courtesy of stockcharts.com.


  1. Invest-Safely.com
  2. >>
  3. Tracking the Stock Market
  4. >>
  5. Stock Market Outlook for 2018-09-30

Sunday, September 23, 2018

Weekend Stock Market Outlook

Stock Market Outlook For The Week of
September 23rd = Uptrend

INDICATORS

20/50 Day Moving Averages: Uptrend
Price & Volume Action: Uptrend
Objective Elliott Wave Analysis: Uptrend

COMMENTARY

Another week, another uptrend signal...although this time there are some storm clouds on the horizon that indicate it's time to be cautious.

Most of the indexes start the week above their 20 and 50 day moving averages, but there's a divergence between those averages. The Dow and the NYSE look extended at the moment; they sit well above their 20 day moving averages. On the other hand, the Nasdaq and Russell 2k are struggling to move past that same moving average. Since the Russell 2K and the Nasdaq are home to a majority of growth stocks, the fact that they're lagging industrials and a more "worldwide" index isn't a sign of strength.

Price charts for $SPX,$COMPQ,$INDU,$NYA,$RUT,$VIX,$TNX,$USD,$CRB,$GOLD

2018-09-23 - US Stock Market Averages

The trading environment still looks good from a price/volume perspective (no new distribution days; Friday's option expiration doesn't count). Many leading stocks are testing support levels or have been unable to make much progress after breaking out...another reason to be careful.

OEW remains in an uptrend to start the week. The market averages tracked by OEW ticked a major checkbox last week; all reached new price highs. So they reassessed the situation. No immediate issues to address, but there are some technical indicators that are flashing yellow. (e.g. relative strength, sector strength, # of stocks above their 200 day moving average, etc.). Therefore, OEW feels it's time to get cautious.

By last Friday, the S&P ($SPX) rallied to the upper trendline of the price channel we're tracking, but was again rebuffed. Each time we've reached the upper bound (or nearly reached) since April, we encountered at least a week of selling. The S&P sits 2-3% above the 50 day / lower price channel trendline, so I won't be concerned until we break below that level.

2018-09-23 - $SPX Technical Analysis - Daily

2018-09-23 - SPX Technical Analysis - Daily

The ADX turned up as a result of last week's strength, with bullish price movement in control. But again, the ADX sits well below 20, meaning it isn't providing the most reliable signals; better to stick with momentum indicators for now. The longer-term view remains the same and supports the case for an uptrend; trading volume returning and the January high supporting.

2018-09-23 - $SPX Technical Analysis - Weekly

2018-09-23 - SPX Technical Analysis - Weekly

Based on the above, I expect a sell-off takes us to back to the January high (just below 2900 for the S&P) and wouldn't be surprised if we tested support at the 50-day/lower price channel. That said, you know the saying about opinions, so the best way for you to prepare, participate, and protect is to form your own opinion based on your own investing process and then take action.


If you find this research helpful, please tell a friend. If you don't find it helpful, tell an enemy. I share articles and other news of interest via Twitter; you can follow me @investsafely. The weekly market outlook is also posted on Facebook and Linkedin.

You can check out how well (or poorly) the outlook has performed as a stand-alone, signal generator using past performance estimates:

For the detailed Elliott Wave Analysis, go to the ELLIOTT WAVE lives on by Tony Caldaro. Charts provided courtesy of stockcharts.com.


  1. Invest-Safely.com
  2. >>
  3. Tracking the Stock Market
  4. >>
  5. Stock Market Outlook for 2018-09-23

Sunday, September 16, 2018

Weekend Stock Market Outlook

Stock Market Outlook For The Week of
September 16th = Uptrend

INDICATORS

20/50 Day Moving Averages: Uptrend
Price & Volume Action: Uptrend
Objective Elliott Wave Analysis: Uptrend

COMMENTARY

Looks like the stock market opted for a run at new highs, rather than searching for support. A quick run through a bunch of recession indicators (trends in the yield curve, unemployment, new home sales, retail sales, etc.) shows no sign of a recession with the next 12 months. So even if the markets do test support key support levels sometime soon, it's most likely a buy the dip opportunity.

All the indexes start the week above their 20 and 50 day moving averages; the Nasdaq and NYSE regained the 20 day average last week.

Price charts for $SPX,$COMPQ,$INDU,$NYA,$RUT,$VIX,$TNX,$USD,$CRB,$GOLD

2018-09-16 - US Stock Market Averages

A solid week of gains on rising trading volume last week; not quite as much volume as expected, but we're in a positive position nonetheless.

OEW is still in an uptrend, and still expecting new highs in all market averages before any kind of next major correction.

2018-09-16 - $SPX Technical Analysis - Daily

2018-09-16 - SPX Technical Analysis - Daily

The S&P ($SPX) starts the week in a good position; fresh off a key support level and in the middle of our price channel. Tell me if you've heard this one before: the ADX is showing a weak trend. At least the directional indicators are supporting of an uptrend (DI+ is greater than DI-). One of these days I'll need to find a momentum indicator to supplement the ADX.

2018-09-16 - $SPX Technical Analysis - Weekly

2018-09-16 - SPX Technical Analysis - Weekly

Extending our view, we see the expected increase in trading volume, and the January high acting as a support level last week.

And since we've successfully recovered the January high, it's a good time to check your asset allocation levels and/or take some profits. Remember: bulls make money, bears make money, pigs get slaughtered.


If you find this research helpful, please tell a friend. If you don't find it helpful, tell an enemy. I share articles and other news of interest via Twitter; you can follow me @investsafely. The weekly market outlook is also posted on Facebook and Linkedin.

You can check out how well (or poorly) the outlook has performed as a stand-alone, signal generator using past performance estimates:

For the detailed Elliott Wave Analysis, go to the ELLIOTT WAVE lives on by Tony Caldaro. Charts provided courtesy of stockcharts.com.


  1. Invest-Safely.com
  2. Tracking the Stock Market
  3. Stock Market Outlook for 2018-09-16

Sunday, September 9, 2018

Weekend Stock Market Outlook

Stock Market Outlook For The Week of
September 9th = Uptrend

INDICATORS

20/50 Day Moving Averages: Uptrend
Price & Volume Action: Uptrend
Objective Elliott Wave Analysis: Uptrend

COMMENTARY

Good guess last week; the markets sold off after hitting a new high. I'm expecting an increase in trading volume this week (more like a return to somewhat normal trading volumes). Anything is possible at this point; maybe we take a run at new highs, maybe we look for support at the 50 day.

All the indexes are above their 50 day moving averages. The S&P500 and Russell 2000 are sitting on their 20 day moving averages, while the Nasdaq and NYSE are below that level.

Price charts for $SPX,$COMPQ,$INDU,$NYA,$RUT,$VIX,$TNX,$USD,$CRB,$GOLD

2018-09-09 - US Stock Market Averages

Most of the indexes added 2 distribution days to their counts, putting the S&P's total at 5. That's a bit elevated, but given the lack of overall volume, not too concerning. If trading volume picks up this week, accumulation/distribution days will be more impactful.

OEW still has an uptrend signal in place.

2018-09-09 - $SPX Technical Analysis - Daily

2018-09-09 - SPX Technical Analysis - Daily

As mentioned at the start, the S&P ($SPX) sold off last week. On the bright side, prices are still above key technical support levels and our price channel remains intact. The ADX turned over...no surprise given 4 consecutive days of lower closing prices. But the directional indicators are essentially even. That's a long way of saying there's no change in outlook based on last week's action.

2018-09-09 - $SPX Technical Analysis - Weekly

2018-09-09 - SPX Technical Analysis - Weekly

Extending the view, the January high could act as support this week. Hopefully it holds, and we rally back to new highs over the next few weeks.

Participant, protect, and prepare.


If you find this research helpful, please tell a friend. If you don't find it helpful, tell an enemy. I share articles and other news of interest via Twitter; you can follow me @investsafely. The weekly market outlook is also posted on Facebook and Linkedin.

You can check out how well (or poorly) the outlook has performed as a stand-alone, signal generator using past performance estimates:

For the detailed Elliott Wave Analysis, go to the ELLIOTT WAVE lives on by Tony Caldaro. Charts provided courtesy of stockcharts.com.


Return from Stock Market Outlook 2018-09-09 to Tracking the Stock Market

Return to Invest-Safely.com

Sunday, September 2, 2018

Weekend Stock Market Outlook

Stock Market Outlook For The Week of
September 2nd = Uptrend

INDICATORS

20/50 Day Moving Averages: Uptrend
Price & Volume Action: Uptrend
Objective Elliott Wave Analysis: Uptrend

COMMENTARY

Short and sweet this week; no change in the signals to start September, and a 4 day trading week as the U.S. markets are closed Monday for the long Labor Day weekend.

All the indexes remain above their 20/50 day moving averages.

Price charts for $SPX,$COMPQ,$INDU,$NYA,$RUT,$VIX,$TNX,$USD,$CRB,$GOLD

2018-09-02 - US Stock Market Averages

Price and volume also continue to signal an uptrend, as does OEW.

The S&P ($SPX) gaped up Monday morning, giving us the higher move we were hoping for last week. The index peaked on Wednesday, which happened to coincide with the upper trendline of the channel we're following, so naturally prices retreated. And even though the reading is still below 20, the ADX saw a pretty big bullish shift.

2018-09-02 - $SPX Technical Analysis - Daily

2018-09-02 - SPX Technical Analysis - Daily

If I had to guess, I'd say we're in for a slight decline this week, and then a run higher in two weeks that coincides with higher trading volume.

2018-09-02 - $SPX Technical Analysis - Weekly

2018-09-02 - SPX Technical Analysis - Weekly

Definitely a positive investing environment to kick-off September, but before you go all super-bull remember that anything is possible once trading volume returns.

Participant, protect, and prepare.


If you find this research helpful, please tell a friend. If you don't find it helpful, tell an enemy. I share articles and other news of interest via Twitter; you can follow me @investsafely. The weekly market outlook is also posted on Facebook and Linkedin.

You can check out how well (or poorly) the outlook has performed as a stand-alone, signal generator using past performance estimates:

For the detailed Elliott Wave Analysis, go to the ELLIOTT WAVE lives on by Tony Caldaro. Charts provided courtesy of stockcharts.com.


Return from Stock Market Outlook 2018-09-02 to Tracking the Stock Market

Return to Invest-Safely.com