Sunday, July 29, 2018

Weekend Stock Market Outlook

Stock Market Outlook For The Week of
July 29th = Uptrend

INDICATORS

20/50 Day Moving Averages: Mixed
Price & Volume Action: Uptrend
Objective Elliott Wave Analysis: Uptrend

COMMENTARY

Earnings season's in full swing, and we're seeing some initial indications of sector rotation. Some big tech names (e.g Facebook, Twitter) sliced through their moving averages on the way to ~20% declines in a single trading session! As always, follow your process, and let it tell you whether this is a buy-the-dip opportunity or something else.

The S&P and Dow start the week above their 20 and 50 day moving averages. The Nasdaq starts just below the 20 day, and above the 50 day. And the Russell 2000 starts below both the 20 and 50 day. The moving average signal starts the week at mixed.

Price charts for $SPX,$COMPQ,$INDU,$NYA,$RUT,$VIX,$TNX,$USD,$CRB,$GOLD

2018-07-29 - US Stock Market Averages

Most of the major indexes picked up a distribution day last week, but the signal remains in an uptrend.

The OEW uptrend signal also remains in place. The S&P target is ~5% above current prices, and then it's time to start charting the next major downtrend. OEW estimates prices could drop 20%-30%, but if you follow a process and good trading money management, you should be good to go.

2018-07-29 - $SPX Technical Analysis - Daily

2018-07-29 - SPX Technical Analysis - Daily

If you've been charting the price channel from earlier this year, you probably noticed that the S&P ($SPX) touched the upper trendline last Wednesday and weren't surprised when the market sold off on Thursday and Friday.

As for the ADX, the advance to the upper channel wasn't strong enough to put the indicator above 20(!). Friday's price decline generated a potential sell signal, as the ADX line turned downward and the DI- spiked. Either way, the trend remains very weak.


If you find this research helpful, please tell a friend. If you don't find it helpful, tell an enemy. I share articles and other news of interest via Twitter; you can follow me @investsafely. The weekly market outlook is also posted on Facebook and Linkedin.

You can check out how well (or poorly) the outlook has performed as a stand-alone, signal generator using past performance estimates:

For the detailed Elliott Wave Analysis, go to the ELLIOTT WAVE lives on by Tony Caldaro. Charts provided courtesy of stockcharts.com.


Return from Stock Market Outlook 2018-07-22 to Tracking the Stock Market

Return to Invest-Safely.com

Sunday, July 22, 2018

Weekend Stock Market Outlook

Stock Market Outlook For The Week of
July 22nd = Uptrend

INDICATORS

20/50 Day Moving Averages: Uptrend
Price & Volume Action: Uptrend
Objective Elliott Wave Analysis: Uptrend

COMMENTARY

U.S. stocks remained above recent resistance levels, reaffirming the uptrend. So it's still game on for buying risk assets. Earnings season kicked off last week, and Q2 GDP estimates are due this week. 10-year treasuries regained their 50-day moving average, while gold and commodities remain in a downtrend.

All the indexes start the week above their 20 and 50 day moving averages.

Price charts for $SPX,$COMPQ,$INDU,$NYA,$RUT,$VIX,$TNX,$USD,$CRB,$GOLD

2018-07-22 - US Stock Market Averages

We saw some higher volume selling last week (Thursday), but the signal remains in an uptrend.

OEW remains in an uptrend, and the 3000 S&P price target (~6% from the current price level) is back in play.

2018-07-22 - $SPX Technical Analysis - Daily

2018-07-22 - SPX Technical Analysis - Daily

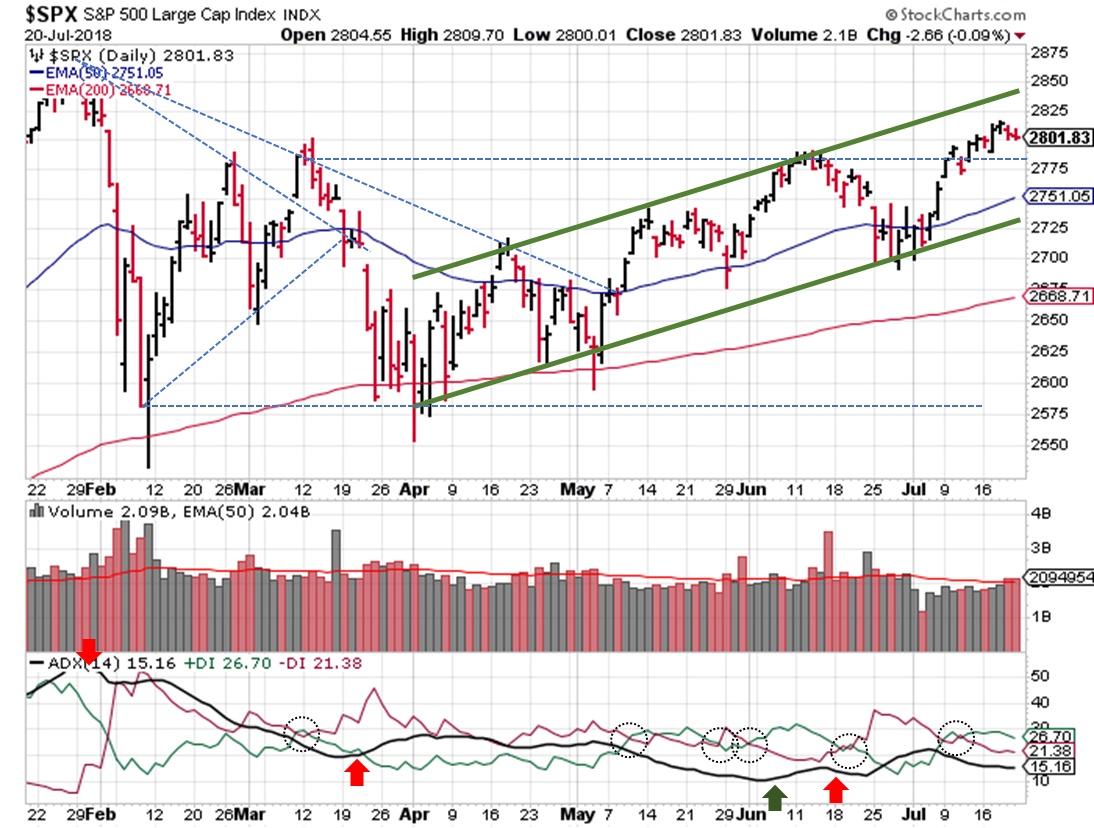
Technically speaking, the S&P ($SPX) meandered around last week and didn't move much in either direction. Prices stayed above the 2787 support level and within the current upward price channel.

As for the ADX, the reading remains below 20, but at least the signal remains bullish.


If you find this research helpful, please tell a friend. If you don't find it helpful, tell an enemy. I share articles and other news of interest via Twitter; you can follow me @investsafely. The weekly market outlook is also posted on Facebook and Linkedin.

You can check out how well (or poorly) the outlook has performed as a stand-alone, signal generator using past performance estimates:

For the detailed Elliott Wave Analysis, go to the ELLIOTT WAVE lives on by Tony Caldaro. Charts provided courtesy of stockcharts.com.


Return from Stock Market Outlook 2018-07-22 to Tracking the Stock Market

Return to Invest-Safely.com

Sunday, July 15, 2018

Weekend Stock Market Outlook

Stock Market Outlook For The Week of
July 15th = Uptrend

INDICATORS

20/50 Day Moving Averages: Uptrend
Price & Volume Action: Uptrend
Objective Elliott Wave Analysis: Uptrend

COMMENTARY

U.S. stocks continued their recent rally from key support levels, reaffirming the uptrend. Commodity prices (especially gold) continue to fall. The yield curve continues to flatten (the difference between 10-year yields and 2-year yields decreases). Since the yield curve has inverted ahead of every recession in the past 40 years (10 year yields are less than 2-year yields), there are a lot of people watching these numbers. But the lag between an inversion and the start of a recession at least 10 months, so we've still got time to make some hay, so to speak.

This week, all the indexes start off above their 20 and 50 day moving averages, as the Dow Industrials joined the other market averages above those technical indicators.

Price charts for $SPX,$COMPQ,$INDU,$NYA,$RUT,$VIX,$TNX,$USD,$CRB,$GOLD

2018-07-15 - US Stock Market Averages

Trading volume remains low, which isn't a sign of strength for the uptrend. But the lack of selling means distribution days continue to fall off the count. With the averages above their 50-day and lack of high-volume selling, this signal shifts back to an "uptrend" to start the week.

OEW also shifted back to an uptrend; the S&P didn't confirm the uptrend as expected.

The S&P ($SPX) broke through the 2787 resistance level last week, and we're back at prices from mid-March. The upward channel remains robust, in terms of providing support and resistance levels. The lower trendline held up really well toward the end of June, saving the uptrend.

As of this week, the upper trendline isn't too far off (~2835 or so); if the channel continues to hold, we're probably in for another round of sideways/negative price movement prior to the end of August.

2018-07-15 - $SPX Technical Analysis - Daily

2018-07-15 - SPX Technical Analysis - Daily

For the ADX, the bearish directional indicator (DI-) fell below the bullish indicator (DI+) and the ADX line fell below 20, indicating the recent bearish trend has weakened. Now we watch for the ADX to rise so that we can confirm the bullish trend. Again, since we close to the upper trendline of the channel, any bullishness may be short lived, like early May and early June.

2018-07-15 - $SPX Technical Analysis - Weekly

2018-07-15 - SPX Technical Analysis - Weekly

Looking longer term, if the S&P finds enough strength to bust out of the channel, the January high at 2872 becomes the next level of resistance.


If you find this research helpful, please tell a friend. If you don't find it helpful, tell an enemy. I share articles and other news of interest via Twitter; you can follow me @investsafely. The weekly market outlook is also posted on Facebook and Linkedin.

You can check out how well (or poorly) the outlook has performed as a stand-alone, signal generator using past performance estimates:

For the detailed Elliott Wave Analysis, go to the ELLIOTT WAVE lives on by Tony Caldaro. Charts provided courtesy of stockcharts.com.


Return from Stock Market Outlook 2018-07-15 to Tracking the Stock Market

Return to Invest-Safely.com

Sunday, July 8, 2018

Weekend Stock Market Outlook

Stock Market Outlook For The Week of
July 8th = Uptrend

INDICATORS

20/50 Day Moving Averages: Uptrend
Price & Volume Action: Mixed
Objective Elliott Wave Analysis: mixed

COMMENTARY

U.S. stocks rallied last week, surviving the start of back and forth tariffs between the U.S. and China. The overall outlook remains in an uptrend.

With the exception of the Dow Jones Industrials, all the indexes recovered both their 20 and 50 day moving averages. So this signal switches back into the uptrend camp.

Price charts for $SPX,$COMPQ,$INDU,$NYA,$RUT,$VIX,$TNX,$USD,$CRB,$GOLD

2018-07-08 - US Stock Market Averages

Low trading volumes make any conclusions from last week's action difficult. But at least we didn't see any high volume sell-offs! So the signal remains "mixed" heading into this week.

OEW continues to show a downtrend "may" be underway, but also mentions that we're still in an uptrend until a downtrend is confirmed...definitely mixed signals there.

2018-07-08 - $SPX Technical Analysis - Daily

2018-07-08 - SPX Technical Analysis - Daily

For the S&P500 ($SPX), the ADX is hanging right around 20. The bearish directional indicator (DI-) remains in charge for now.

2018-07-08 - $SPX Technical Analysis - Weekly

2018-07-08 - SPX Technical Analysis - Weekly

The support levels near 2700 held (short and long term views), and the S&P bounced off the lower channel of the current uptrend. Trading volume was lacking though, so we may retest the uptrend before moving higher. 2787 remains the upside resistance level.


If you find this research helpful, please tell a friend. If you don't find it helpful, tell an enemy. I share articles and other news of interest via Twitter; you can follow me @investsafely. The weekly market outlook is also posted on Facebook and Linkedin.

You can check out how well (or poorly) the outlook has performed as a stand-alone, signal generator using past performance estimates:

For the detailed Elliott Wave Analysis, go to the ELLIOTT WAVE lives on by Tony Caldaro. Charts provided courtesy of stockcharts.com.


Return from Stock Market Outlook 2018-07-08 to Tracking the Stock Market

Return to Invest-Safely.com

Sunday, July 1, 2018

Weekend Stock Market Outlook

Stock Market Outlook For The Week of
July 1st = Uptrend

INDICATORS

20/50 Day Moving Averages: Mixed
Price & Volume Action: Mixed
Objective Elliott Wave Analysis: mixed

COMMENTARY

U.S. stocks ended Q2 with a whimper, succumbing to selling pressure last week. The market averages gaped down, and then spent the remainder of the week struggling to recover. We start Q3 with the uptrend technically intact (i.e. no outright downtrend signals), although all the signals changed to "mixed". Good arguments could be made for switching them to downtrends, so monitor the markets this week and adjust. As of today, we're not quite there, but be prepared.

The first week in July starts with both the Dow and the NYSE below their respective 20 and 50 day moving averages. Those 2 indexes also sit below their 200-day moving average; a bearish signal. The NASDAQ and S&P500 are below their 20-day moving averages and above their 50 day moving averages (just barely). So the signal changes to mixed, though you could make a decent case for changing it to a downtrend.

Price charts for $SPX,$COMPQ,$INDU,$NYA,$RUT,$VIX,$TNX,$USD,$CRB,$GOLD

2018-07-01 - US Stock Market Averages

Price/volume action also weakened further last week. As mentioned above, the S&P is still above its 50 day moving average, but distribution days have increased. Quality growth stocks are extended, sitting well above their proper buy points, leaving the market averages in search of leadership to drive prices higher. Again, the signal changes to mixed, with the strong scent of a downtrend in the air.

OEW indicates a downtrend may be underway, with our next support level somewhere below ~2650.

For the S&P500 ($SPX), the ADX now sits at 20, with the bearish directional indicator (DI-) rising sharping after the cross over two weeks ago, highlight an increasingly strong bearish trend.

2018-07-01 - $SPX Technical Analysis - Daily

2018-07-01 - SPX Technical Analysis - Daily

The 2740 price level offered no support last week and the S&P closed below the lower channel and the 50-day on the 27th. The positive news in this otherwise downbeat update? The S&P recovered, and starts this week above both of those support areas. Similar to early May, but not quite as strong.

2018-07-01 - $SPX Technical Analysis - Weekly

2018-07-01 - SPX Technical Analysis - Weekly

From a weekly perspective, prices also found support at the long-term lower channel from early 2016.

If all those support areas around 2700 don't hold, the next support level is in the 2650's (per OEW and the 200-day/40-week moving averages). And after that we head back to the lowest closing price in February (2581). On the upside, 2787 is still the target for confirming a move higher.

A short trading week is on tap, with U.S. markets closed for Independence Day celebrations on July 4th. Hopefully you're looking forward to some vacation time in the near future as well!


If you find this research helpful, please tell a friend. If you don't find it helpful, tell an enemy. I share articles and other news of interest via Twitter; you can follow me @investsafely. The weekly market outlook is also posted on Facebook and Linkedin.

You can check out how well (or poorly) the outlook has performed as a stand-alone, signal generator using past performance estimates:

For the detailed Elliott Wave Analysis, go to the ELLIOTT WAVE lives on by Tony Caldaro. Charts provided courtesy of stockcharts.com.


Return from Stock Market Outlook 2018-07-01 to Tracking the Stock Market

Return to Invest-Safely.com