Stock Market Outlook For The Week of
August 13th = Downtrend
INDICATORS
20/50 Day Moving Averages: Downtrend
Price & Volume Action: Downtrend
Objective Elliott Wave Analysis: Uptrend
With all the indexes below key moving averages and high levels of institutional selling (in the form of distribution days) clustered over the past two weeks, the overall market outlook shifted to downtrend this week. These periods are usually short lived, so hopefully we'll see some strength return this week and the indexes will retake key support levels. In the meantime, investors can take some profits and/or cut mediocre performers loose (see analysis of Nvidia's ($NVDA) recent price action below).
It sure seems like the indexes have rolled over, with the Russell 2000 leading markets to the downside, pushing this signal into downtrend territory. Last Sunday, all the major indexes except the R2K remained above their 20 and 50 day moving averages. This week, only the DJIA remains at those levels; all the other indexes closed the week below their 20 and 50 day moving averages. The Russell actually reached its 200 day moving average...any further declines and that index is in bear market territory.
2017-08-13-US Stock Market Averages
The price/volume indicator also switched to downtrend, price levels are below the 50 day moving average and distribution days are high for all indexes (7 for the S&P500, NYSE, DJIA, and Nasdaq).
OEW remains in an uptrend, although several potential scenarios are under consideration.
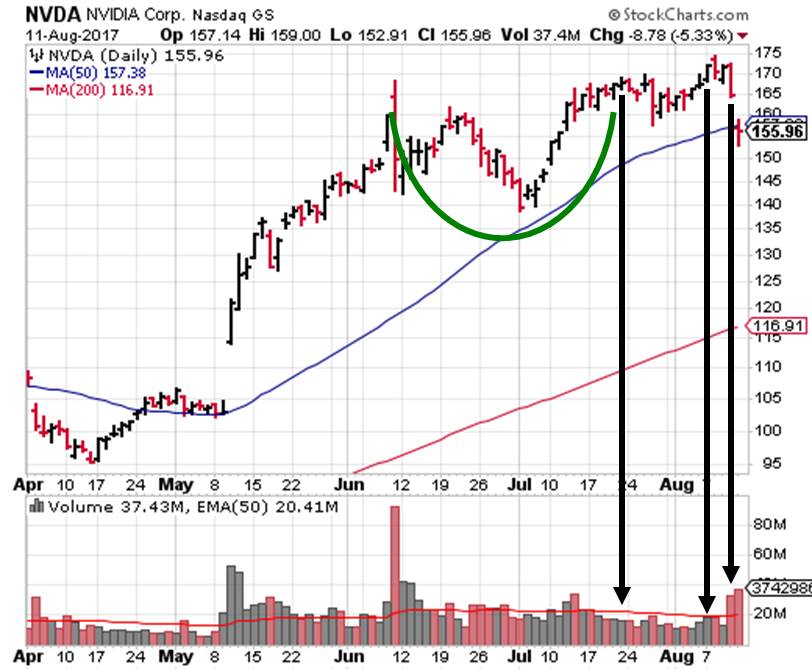
Revisiting last week's commentary on the recent difficulty holding new positions through earnings, NVDA crushed their earnings on Thursday, raising revenues by 56%, and EPS increasing 124%! For a stock that has performed so well over the year, to see such a massive earnings beat is surprising. And after hours, the stock tanked, and continued to fall into Friday's trading session (currently, talking heads are attributing this to lower than expected revenues in one of their operating segments).
The stock had recently attempted a break-out, so investors looking to initiate a position likely came away frustrated. But this goes back to the point that the markets can stay irrational longer that you can stay solvent. Whatever the reason for the price action, it happened. Prices move against you sometimes, and for you at others. The key is to make sure that you aren't destroyed when things don't work out the way you or anyone else thinks they should.
Thoughts on Nvidia ($NVDA)
Fundamentally, the company is sound; sales and earnings have steadily increased, debt is manageable. Technically, the latest chart pattern wasn't great for entering new positions, but I've seen worse. Warning signs were there, in the form of weak price action. Usually this price action precedes an earnings miss, or some other bad news (and a subsequent sell-off). Not the case with Nvidia. In fact, given the size of the top and bottom line performance, the situation was ideal for a massive gap up!
Nvidia's stock price was up 176% over the past 12 months (at Thursday's close). It had already broken out a couple times this year, so new bases are more likely to meet increased selling as investors book gains.
The price pattern cup shape wasn't symmetrical, met the minimum timeframe of 6 weeks, and trading volume was low as the right side of the base was built in early July. The stock actually broke out of the base on July 21st, (just barely), but trading volume was below average, and the stock price meandered sideways. August 7th saw another attempt to rise above resistance at $170, but again, lack of volume showed little conviction from large players. Looking at the weekly chart puts the sell-off in perspective for buyers of the May breakout. For all the commotion last week, Nvidia sits at the 50 day moving average. Investors with existing positions are likely monitoring price action closely and considering taking profits.
If you find this research helpful, please tell a friend. I share articles and other news of interest via Twitter; you can follow me @investsafely. The weekly market outlook is also posted on Facebook and Linkedin.
You can check out how well (or poorly) the outlook has tracked the market using past performance estimates:
For the detailed Elliott Wave Analysis, go to the ELLIOTT WAVE lives on by Tony Caldaro. Charts provided courtesy of stockcharts.com.


No comments:
Post a Comment