Sunday, September 9, 2018

Weekend Stock Market Outlook

Stock Market Outlook For The Week of
September 9th = Uptrend

INDICATORS

20/50 Day Moving Averages: Uptrend
Price & Volume Action: Uptrend
Objective Elliott Wave Analysis: Uptrend

COMMENTARY

Good guess last week; the markets sold off after hitting a new high. I'm expecting an increase in trading volume this week (more like a return to somewhat normal trading volumes). Anything is possible at this point; maybe we take a run at new highs, maybe we look for support at the 50 day.

All the indexes are above their 50 day moving averages. The S&P500 and Russell 2000 are sitting on their 20 day moving averages, while the Nasdaq and NYSE are below that level.
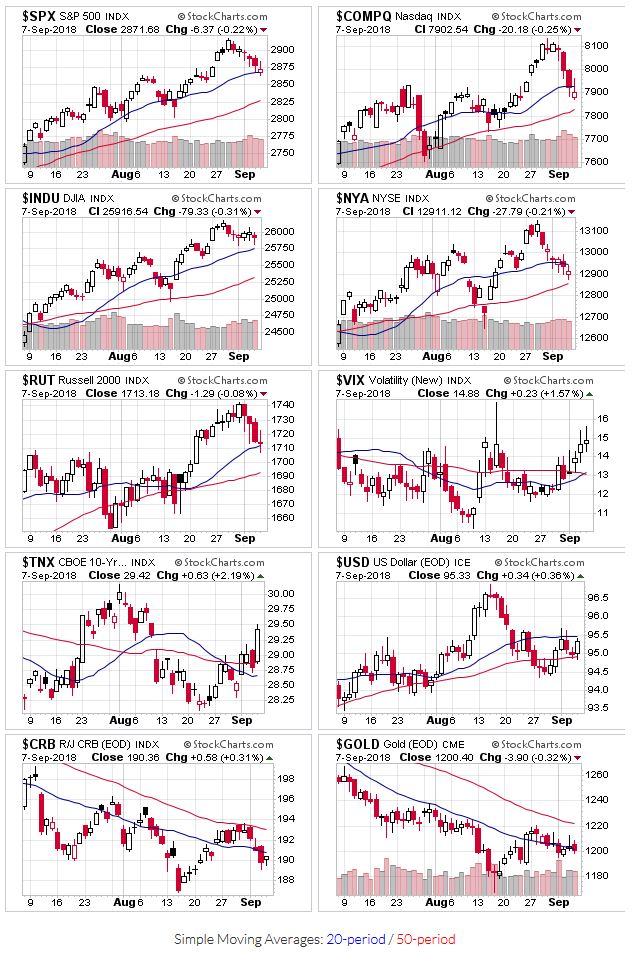
Price charts for $SPX,$COMPQ,$INDU,$NYA,$RUT,$VIX,$TNX,$USD,$CRB,$GOLD

2018-09-09 - US Stock Market Averages

Most of the indexes added 2 distribution days to their counts, putting the S&P's total at 5. That's a bit elevated, but given the lack of overall volume, not too concerning. If trading volume picks up this week, accumulation/distribution days will be more impactful.

OEW still has an uptrend signal in place.

2018-09-09 - $SPX Technical Analysis - Daily

2018-09-09 - SPX Technical Analysis - Daily

As mentioned at the start, the S&P ($SPX) sold off last week. On the bright side, prices are still above key technical support levels and our price channel remains intact. The ADX turned over...no surprise given 4 consecutive days of lower closing prices. But the directional indicators are essentially even. That's a long way of saying there's no change in outlook based on last week's action.
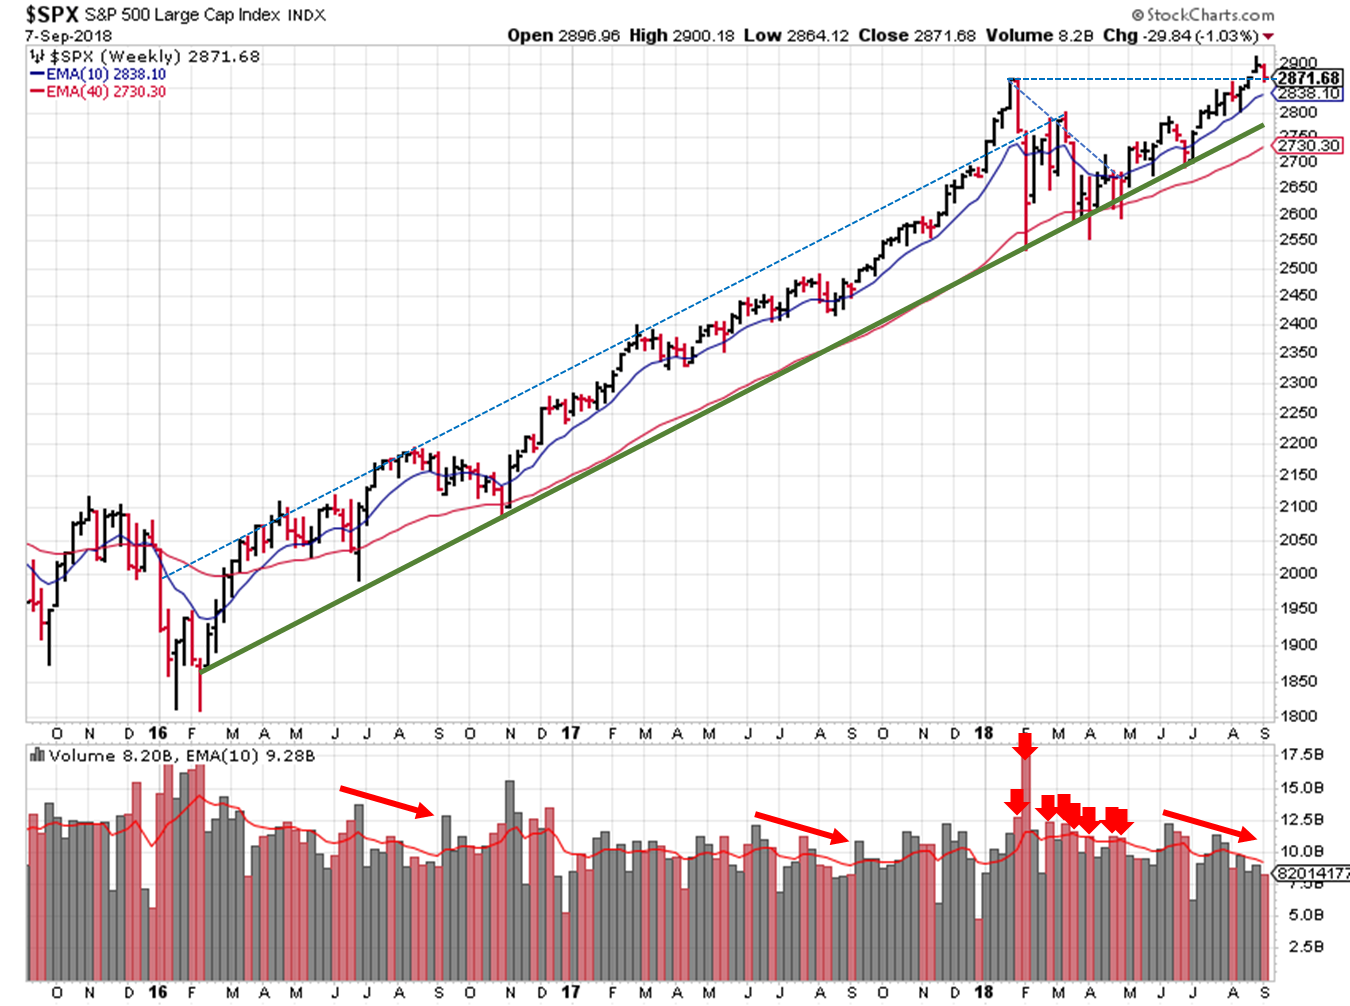
2018-09-09 - $SPX Technical Analysis - Weekly

2018-09-09 - SPX Technical Analysis - Weekly

Extending the view, the January high could act as support this week. Hopefully it holds, and we rally back to new highs over the next few weeks.

Participant, protect, and prepare.


If you find this research helpful, please tell a friend. If you don't find it helpful, tell an enemy. I share articles and other news of interest via Twitter; you can follow me @investsafely. The weekly market outlook is also posted on Facebook and Linkedin.

You can check out how well (or poorly) the outlook has performed as a stand-alone, signal generator using past performance estimates:

For the detailed Elliott Wave Analysis, go to the ELLIOTT WAVE lives on by Tony Caldaro. Charts provided courtesy of stockcharts.com.


Return from Stock Market Outlook 2018-09-09 to Tracking the Stock Market

Return to Invest-Safely.com

Sunday, September 2, 2018

Weekend Stock Market Outlook

Stock Market Outlook For The Week of
September 2nd = Uptrend

INDICATORS

20/50 Day Moving Averages: Uptrend
Price & Volume Action: Uptrend
Objective Elliott Wave Analysis: Uptrend

COMMENTARY

Short and sweet this week; no change in the signals to start September, and a 4 day trading week as the U.S. markets are closed Monday for the long Labor Day weekend.

All the indexes remain above their 20/50 day moving averages.

Price charts for $SPX,$COMPQ,$INDU,$NYA,$RUT,$VIX,$TNX,$USD,$CRB,$GOLD

2018-09-02 - US Stock Market Averages

Price and volume also continue to signal an uptrend, as does OEW.

The S&P ($SPX) gaped up Monday morning, giving us the higher move we were hoping for last week. The index peaked on Wednesday, which happened to coincide with the upper trendline of the channel we're following, so naturally prices retreated. And even though the reading is still below 20, the ADX saw a pretty big bullish shift.

2018-09-02 - $SPX Technical Analysis - Daily

2018-09-02 - SPX Technical Analysis - Daily

If I had to guess, I'd say we're in for a slight decline this week, and then a run higher in two weeks that coincides with higher trading volume.

2018-09-02 - $SPX Technical Analysis - Weekly

2018-09-02 - SPX Technical Analysis - Weekly

Definitely a positive investing environment to kick-off September, but before you go all super-bull remember that anything is possible once trading volume returns.

Participant, protect, and prepare.


If you find this research helpful, please tell a friend. If you don't find it helpful, tell an enemy. I share articles and other news of interest via Twitter; you can follow me @investsafely. The weekly market outlook is also posted on Facebook and Linkedin.

You can check out how well (or poorly) the outlook has performed as a stand-alone, signal generator using past performance estimates:

For the detailed Elliott Wave Analysis, go to the ELLIOTT WAVE lives on by Tony Caldaro. Charts provided courtesy of stockcharts.com.


Return from Stock Market Outlook 2018-09-02 to Tracking the Stock Market

Return to Invest-Safely.com

Sunday, August 26, 2018

Weekend Stock Market Outlook

Stock Market Outlook For The Week of
August 26th = Uptrend

INDICATORS

20/50 Day Moving Averages: Uptrend
Price & Volume Action: Uptrend
Objective Elliott Wave Analysis: Uptrend

COMMENTARY

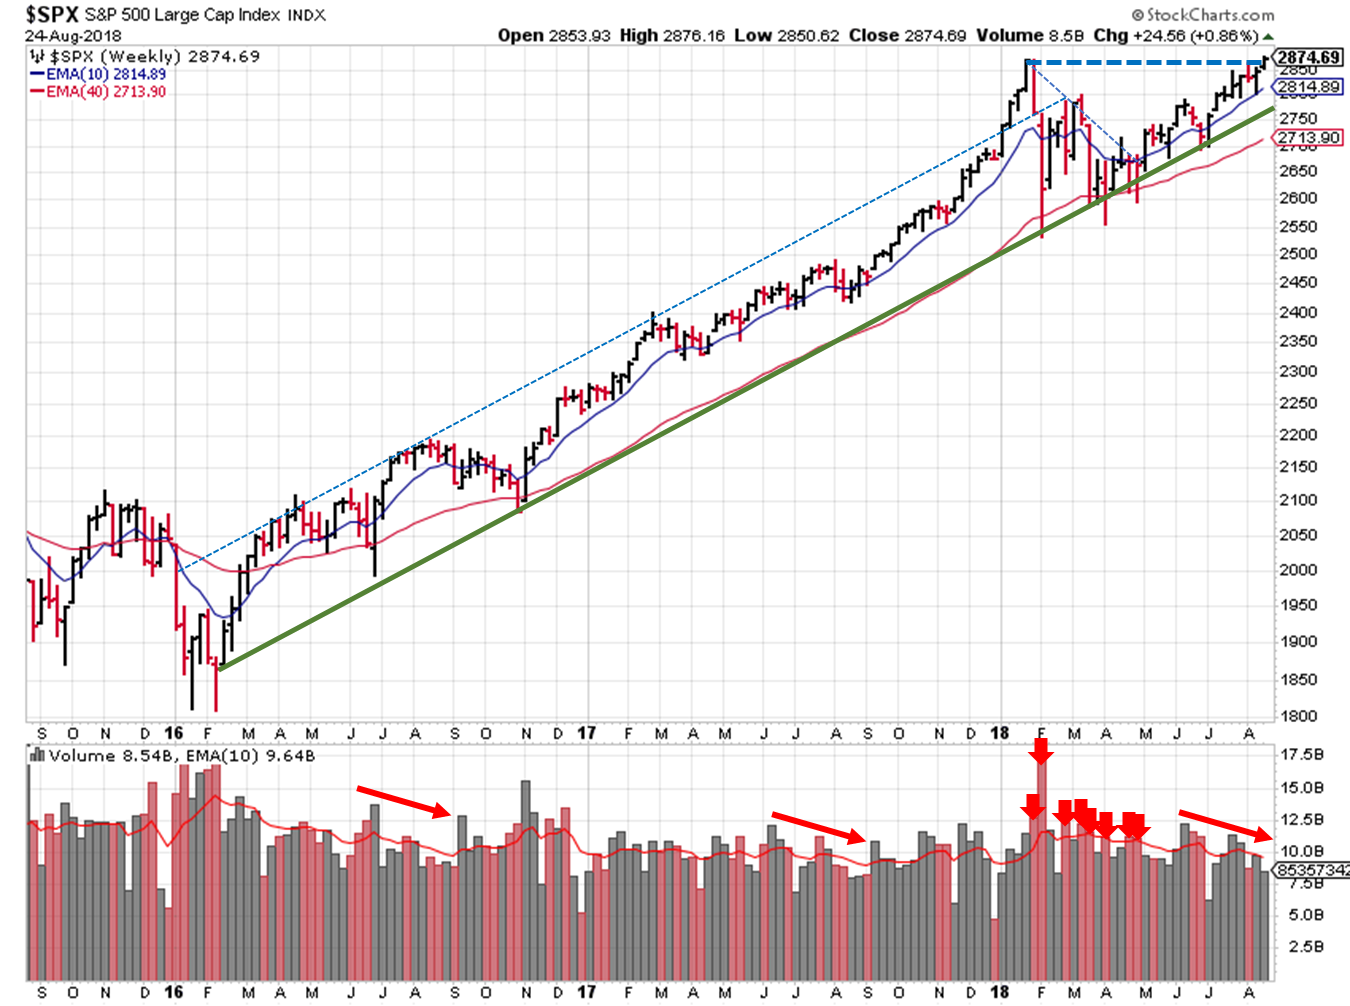
Well...it's Facebook official; my feed told me that we're now a part of the longest bull market in history. On Wednesday, the current bull market hit 3,453 days, going back to March 9, 2009. Other articles state that the longest bull market was the 4,494 day version that ran from 1987 to early 2000.

2009-2018 Bull Market - SPX

2009-2018 Bull Market - SPX

The debate over 1st or 2nd aside, don't overlook the nearly 20% declines we saw along the way (e.g. April to June 2010, April to October 2011, June 2015 to February 2016). Those "corrections" were important; large enough to reset expectations, earnings, etc., without triggering the technical definition of a bear market. Even the swift decline earlier this year was an important cooling off period.

Had any of the corrections ran a little longer and hit bear market territory (>20%), then the longest bull market ever would actually be split into multiple bull markets. Regardless, the run from market lows in 2009 is impressive, and shows the importance of "corrections" along the way. Not to be outdone, commodities (even gold!), are trying to get in on the action, rallying off their lows last week.

No surprise here...all the indexes start the week above their 20 and 50 day moving averages.

Price charts for $SPX,$COMPQ,$INDU,$NYA,$RUT,$VIX,$TNX,$USD,$CRB,$GOLD

2018-08-26 - US Stock Market Averages

The price/volume indicator also keeps its uptrend, as well as the uptrend signal from OEW. They're also expecting the Dow Jones and NYSE to hit all time highs before a significant correction occurs.

2018-08-26 - $SPX Technical Analysis - Daily

2018-08-26 - SPX Technical Analysis - Daily

The S&P ($SPX) is back at all time highs, ending the week just above the prior all time of 2873 high set in January. The ADX is pitifully weak, but at least it's still bullish. I'm assuming we'll see some strength return in September (see below).

2018-08-26 - $SPX Technical Analysis - Weekly

2018-08-26 - SPX Technical Analysis - Weekly

The S&P is still too close to the previous high (less than 2 points) to say it "passed" a key resistance level. Ideally, we'd see a 2-3% upward move in higher trading volume this week, but I doubt it. If past is precedent, we'll see lower trading volumes this week and next, with a sharp rise during the first full week of September.

Recent breakouts of leading growth stocks have been a mixed back this earnings season. Just crushing earnings expectations isn't enough...raising guidance is also required these days, which is typical of activity late in a market cycle.

Participant, protect, and prepare.


If you find this research helpful, please tell a friend. If you don't find it helpful, tell an enemy. I share articles and other news of interest via Twitter; you can follow me @investsafely. The weekly market outlook is also posted on Facebook and Linkedin.

You can check out how well (or poorly) the outlook has performed as a stand-alone, signal generator using past performance estimates:

For the detailed Elliott Wave Analysis, go to the ELLIOTT WAVE lives on by Tony Caldaro. Charts provided courtesy of stockcharts.com.


Return from Stock Market Outlook 2018-08-26 to Tracking the Stock Market

Return to Invest-Safely.com

Sunday, August 19, 2018

Weekend Stock Market Outlook

Stock Market Outlook For The Week of
August 19th = Uptrend

INDICATORS

20/50 Day Moving Averages: Uptrend
Price & Volume Action: Uptrend
Objective Elliott Wave Analysis: Uptrend

COMMENTARY

Now I can say that earnings season is winding down; 90% of the companies in the S&P500 have reported earnings for Q2. Sales, profits, and earnings per share are all higher...which is typical for this stage in the business cycle.

All the indexes are back above their 20 and 50 day moving averages this week.

Price charts for $SPX,$COMPQ,$INDU,$NYA,$RUT,$VIX,$TNX,$USD,$CRB,$GOLD

2018-08-19 - US Stock Market Averages

All the indexes picked up a distribution day last Wednesday. And although prices bounced off session lows, volume fell on Thursday and Friday (except for the Dow). Ideally, volume would increase during the rebound.

OEW uptrend call remains in play. The S&P didn't quite reach the 2790 support level (2,802 on Wednesday), but the decline was enough to meet the "test support" call from last week, so it's risk on.

The S&P ($SPX) found support just above the 50-day moving average last week, so a test of the lower channel trendline will have to wait. A weak trend persists per the ADX, with the bearish directional indicator (DI-) just above the bullish (DI+).

2018-08-19 - $SPX Technical Analysis - Daily

2018-08-19 - SPX Technical Analysis - Daily

Expanding the view, the S&P is within striking distance of the all-time high from January (2,873); we topped out at 2,863 two weeks ago after touching the upper channel. Keep an eye on that level as potential support/resistance. Powering through on high trading volume is a great sign...selling off not so much.

2018-08-19 - $SPX Technical Analysis - Weekly

2018-08-19 - SPX Technical Analysis - Weekly

Despite the recent spike in volatility, trading remains subdued (it IS August after all). Now is not the time to be complacent. Rather, take this time to review your holdings and adjust position sizes that may be out of whack. And don't forget to review/renew your watch lists. Mine have grown a bit this month, even for income investments!


If you find this research helpful, please tell a friend. If you don't find it helpful, tell an enemy. I share articles and other news of interest via Twitter; you can follow me @investsafely. The weekly market outlook is also posted on Facebook and Linkedin.

You can check out how well (or poorly) the outlook has performed as a stand-alone, signal generator using past performance estimates:

For the detailed Elliott Wave Analysis, go to the ELLIOTT WAVE lives on by Tony Caldaro. Charts provided courtesy of stockcharts.com.


Return from Stock Market Outlook 2018-08-19 to Tracking the Stock Market

Return to Invest-Safely.com

Sunday, August 12, 2018

Weekend Stock Market Outlook

Stock Market Outlook For The Week of
August 12th = Uptrend

INDICATORS

20/50 Day Moving Averages: Uptrend
Price & Volume Action: Uptrend
Objective Elliott Wave Analysis: Uptrend

COMMENTARY

I was a bit early in my "earnings season is winding down" comment; must have been looking at the wrong week again. Not that earnings mattered...a trade war with Turkey and a falling Lira drove our downside move last week.

All the indexes start this week above their 50 day, and only the NYSE is below it's 20.

Price charts for $SPX,$COMPQ,$INDU,$NYA,$RUT,$VIX,$TNX,$USD,$CRB,$GOLD

2018-08-12 - US Stock Market Averages

Most of the indexes also picked up two distribution days (Thursday/Friday). Since the overall trading volume was so low, it's hard to make the case that institutional selling is picked up. It's definitely something to watch...August is notoriously bad for U.S. equities, and the trading environment seems too quiet considering all the macro factors that are currently in flux (tariffs, currency, QE/QT, etc.)

Objective Elliott Wave remains in uptrend mode, but there's an expectation that the S&P will test support in the 2790's in the next week or two (coincidentally, that's roughly the 50-day moving average, and just a few points above the 2780 support level from March/June)

2018-08-12 - $SPX Technical Analysis - Daily

2018-08-12 - SPX Technical Analysis - Daily

The S&P ($SPX) remains firmly entrenched the rising channel we've been tracking. Last week, prices tested the upper trendline. And again, they headed lower afterwards.

The ADX continues to show a weak trend, but a slope change and a DI- indicator spike shows what little trend we have is bearish. The chart reminds me of price action / ADX readings from mid-June...just before the S&P fell to the lower trendline of the price channel.

2018-08-12 - $SPX Technical Analysis - Weekly

2018-08-12 - SPX Technical Analysis - Weekly

Overall, most signs point to a positive environment for investing and trading in U.S. equities, but that lack of volume and spike in volatility is something to watch. The ADX appears to align with OEWs call for some price drops over the next week or two, but that should be a BTD opportunity.


If you find this research helpful, please tell a friend. If you don't find it helpful, tell an enemy. I share articles and other news of interest via Twitter; you can follow me @investsafely. The weekly market outlook is also posted on Facebook and Linkedin.

You can check out how well (or poorly) the outlook has performed as a stand-alone, signal generator using past performance estimates:

For the detailed Elliott Wave Analysis, go to the ELLIOTT WAVE lives on by Tony Caldaro. Charts provided courtesy of stockcharts.com.


Return from Stock Market Outlook 2018-08-12 to Tracking the Stock Market

Return to Invest-Safely.com

Sunday, August 5, 2018

Weekend Stock Market Outlook

Stock Market Outlook For The Week of
August 5th = Uptrend

INDICATORS

20/50 Day Moving Averages: Uptrend
Price & Volume Action: Uptrend
Objective Elliott Wave Analysis: Uptrend

COMMENTARY

Earnings season for U.S. stocks is winding down. All in all it was pretty positive, though some big names sold off hard.

All the indexes start this week above their 50 day, and only the Russell is below it's 20. That's enough to put the moving average signal is back to an uptrend.

Price charts for $SPX,$COMPQ,$INDU,$NYA,$RUT,$VIX,$TNX,$USD,$CRB,$GOLD

2018-08-05 - US Stock Market Averages

No significant change in the number of distribution days, and the Nasdaq rebounded off its 50 day. So the price and volume indicator remains in an uptrend.

And we're still in an uptrend according to Objective Elliott Wave as well.

2018-08-05 - $SPX Technical Analysis - Daily

2018-08-05 - SPX Technical Analysis - Daily

The S&P ($SPX) price channel remains in play, and the 2800 price level has proven to be a good support level.

The ADX continues to show a weak trend, but it's hard to tell which direction is winning; the direction indicators are on top of one another and both are declining.


If you find this research helpful, please tell a friend. If you don't find it helpful, tell an enemy. I share articles and other news of interest via Twitter; you can follow me @investsafely. The weekly market outlook is also posted on Facebook and Linkedin.

You can check out how well (or poorly) the outlook has performed as a stand-alone, signal generator using past performance estimates:

For the detailed Elliott Wave Analysis, go to the ELLIOTT WAVE lives on by Tony Caldaro. Charts provided courtesy of stockcharts.com.


Return from Stock Market Outlook 2018-08-05 to Tracking the Stock Market

Return to Invest-Safely.com

Sunday, July 29, 2018

Weekend Stock Market Outlook

Stock Market Outlook For The Week of
July 29th = Uptrend

INDICATORS

20/50 Day Moving Averages: Mixed
Price & Volume Action: Uptrend
Objective Elliott Wave Analysis: Uptrend

COMMENTARY

Earnings season's in full swing, and we're seeing some initial indications of sector rotation. Some big tech names (e.g Facebook, Twitter) sliced through their moving averages on the way to ~20% declines in a single trading session! As always, follow your process, and let it tell you whether this is a buy-the-dip opportunity or something else.

The S&P and Dow start the week above their 20 and 50 day moving averages. The Nasdaq starts just below the 20 day, and above the 50 day. And the Russell 2000 starts below both the 20 and 50 day. The moving average signal starts the week at mixed.

Price charts for $SPX,$COMPQ,$INDU,$NYA,$RUT,$VIX,$TNX,$USD,$CRB,$GOLD

2018-07-29 - US Stock Market Averages

Most of the major indexes picked up a distribution day last week, but the signal remains in an uptrend.

The OEW uptrend signal also remains in place. The S&P target is ~5% above current prices, and then it's time to start charting the next major downtrend. OEW estimates prices could drop 20%-30%, but if you follow a process and good trading money management, you should be good to go.

2018-07-29 - $SPX Technical Analysis - Daily

2018-07-29 - SPX Technical Analysis - Daily

If you've been charting the price channel from earlier this year, you probably noticed that the S&P ($SPX) touched the upper trendline last Wednesday and weren't surprised when the market sold off on Thursday and Friday.

As for the ADX, the advance to the upper channel wasn't strong enough to put the indicator above 20(!). Friday's price decline generated a potential sell signal, as the ADX line turned downward and the DI- spiked. Either way, the trend remains very weak.


If you find this research helpful, please tell a friend. If you don't find it helpful, tell an enemy. I share articles and other news of interest via Twitter; you can follow me @investsafely. The weekly market outlook is also posted on Facebook and Linkedin.

You can check out how well (or poorly) the outlook has performed as a stand-alone, signal generator using past performance estimates:

For the detailed Elliott Wave Analysis, go to the ELLIOTT WAVE lives on by Tony Caldaro. Charts provided courtesy of stockcharts.com.


Return from Stock Market Outlook 2018-07-22 to Tracking the Stock Market

Return to Invest-Safely.com