Sunday, March 25, 2018

Weekend Stock Market Outlook

Stock Market Outlook For The Week of
March 25th = Downtrend

INDICATORS

20/50 Day Moving Averages: Downtrend
Price & Volume Action: Downtrend
Objective Elliott Wave Analysis: Downtrend

COMMENTARY

Another quarter-point rate hike from the Fed paled in comparison to Thursday's announcement of U.S. plans for intellectual property tariffs on up to $60 billion of high-tech goods from China. There's a good chance the tariffs are a negotiating ploy, but that won't stop knee-jerk reactions in the stock market. Technology stocks also faced selling pressure, associated with Facebook's recent data privacy issues. For the week, the indexes lost between 5% and 6%, give or take.

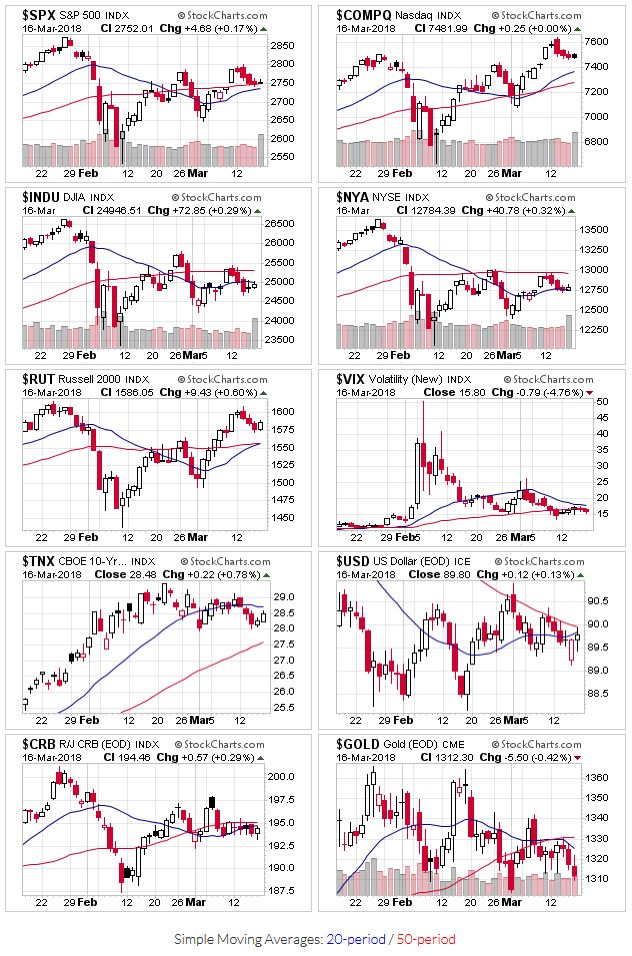
All the indexes start this week below their 20 and 50 day moving averages, putting the moving average signal back into downtrend territory. The S&P rests on its 200 day moving average, with the other indexes within striking distance. Prior to this year, the S&P500 hasn't touched the 200 day since the US election in 2016.

Price charts for $SPX,$COMPQ,$INDU,$NYA,$RUT,$VIX,$TNX,$USD,$CRB,$GOLD

2018-03-25-US Stock Market Averages

Price and volume action also fell back into downtrend territory due to high volume selling during the week and prices dropping below the 50-day moving average.

OEW updated the wave count to reflect the sell off last week, putting the current signal back into downtrend territory.

It appears that the previous "uptrend" was really just a corrective "rally" in an ongoing downtrend. As I mentioned last week, this type of whipsaw action is one of the reasons I'm looking for another indicator that is more accurate during periods of volatility.

2018-03-25 - $SPX Technical Analysis

2018-03-25 - SPX Technical Analysis

Last week, the ADX was showing a weakening bearish trend (DI- was higher than DI+ but the ADX was declining). This week, we have a strengthening bearish trend (DI- higher than DI+ and the ADX is rising). Combined with a break below the 50 day moving average on higher volume (Monday's price action), and a sell signal would have been generated on Monday.

After a week of selling, markets are usually considered "oversold". That's not an invitation to buy, because markets can continue to sell off. But be on the lookout for high volume buying when institutional investors cover their short positions and/or buy the dip. Until then, check your stops, cut your losses, and update your watch list with stocks that are resisting the current weakness.


If you find this research helpful, please tell a friend. If you don't find it helpful, tell an enemy. I share articles and other news of interest via Twitter; you can follow me @investsafely. The weekly market outlook is also posted on Facebook and Linkedin.

You can check out how well (or poorly) the outlook has tracked the market using past performance estimates:

For the detailed Elliott Wave Analysis, go to the ELLIOTT WAVE lives on by Tony Caldaro. Charts provided courtesy of stockcharts.com.


Sunday, March 18, 2018

Weekend Stock Market Outlook

Stock Market Outlook For The Week of
March 18th = Uptrend

INDICATORS

20/50 Day Moving Averages: Uptrend
Price & Volume Action: Uptrend
Objective Elliott Wave Analysis: Uptrend

COMMENTARY

The stock market outlook remains in uptrend territory to kick off the first week of spring. All eyes will be on the U.S. Federal Reserve this week; another quarter-point rate hike is expected by the end of their 2-day meeting.

Most of the indexes remain above their 20 and 50 day moving averages. The DJIA lags other averages, sitting below both those technical indicators.

Price charts for $SPX,$COMPQ,$INDU,$NYA,$RUT,$VIX,$TNX,$USD,$CRB,$GOLD

2018-03-18-US Stock Market Averages

Price and volume action also stays in uptrend territory. The distribution day count remains manageable. Note: Trading volume spiked last Friday on option / futures contract expirations.

OEW remains in an uptrend. In a nod to the bulls, Tony no longer sees a massive sell-off anytime soon, stating:

    After a January all-time high of SPX 2873, ending a strong 10-month uptrend. A drop of nearly 12% in two weeks followed. The perma-bears were back out in force. The crash they keep calling for has already occurred: 2007-2009. Those types of events only occur once in a lifetime. There will be bear markets in the future. But nothing like that for a very long time.

I'm looking for a potential replacement for the 20/50 day moving average; an indicator that works well when markets are volatile and/or extended from trending indicators such as moving averages. The Average Directional Index (ADX) caught my eye because it flashed a sell signal for the $SPX just ahead of the February sell off. At the moment, it's showing a bearish environment (DI- is higher than DI+) that's weakening (ADX is declining).


If you find this research helpful, please tell a friend. If you don't find it helpful, tell an enemy. I share articles and other news of interest via Twitter; you can follow me @investsafely. The weekly market outlook is also posted on Facebook and Linkedin.

You can check out how well (or poorly) the outlook has tracked the market using past performance estimates:

For the detailed Elliott Wave Analysis, go to the ELLIOTT WAVE lives on by Tony Caldaro. Charts provided courtesy of stockcharts.com.


Return from Stock Market Outlook 2018-03-18 to Tracking the Stock Market

Return to Invest-Safely.com

Sunday, March 11, 2018

Weekend Stock Market Outlook

Stock Market Outlook For The Week of
March 11th = Uptrend

INDICATORS

20/50 Day Moving Averages: Uptrend
Price & Volume Action: Uptrend
Objective Elliott Wave Analysis: Uptrend

COMMENTARY

Friday's impressive break-out put the averages back on solid footing, and all three signals are green to start this week. The Nasdaq leads the way, jumping to new highs; the Russell 2000 is a close second place.

The indexes reversed course last week, and all of them start this week above their 20 and 50 day moving averages.

Price charts for $SPX,$COMPQ,$INDU,$NYA,$RUT,$VIX,$TNX,$USD,$CRB,$GOLD

2018-03-11-US Stock Market Averages

Price and volume action is back into uptrend territory. Growth stocks showed signs of life and indexes are back above their 50-day moving averages. That said, most growth stocks are still outside of buy zones, so we'll have to see if they set up some flat bases, or if new leaders arise.

OEW continues to see an uptrend.

During the past few weeks, the outlook signal switched back and forth between uptrends and downtrends. This type of action is a common aspect of trading systems, regardless of analysis technique. Certain methods work better under certain conditions, which is why a combination of signals is better than just one.

It's also a reminder of the importance of money management in your process. Make sure you always define the maximum allowable loss for each trade; 1% of the account value is what a majority of professionals use.


If you find this research helpful, please tell a friend. If you don't find it helpful, tell an enemy. I share articles and other news of interest via Twitter; you can follow me @investsafely. The weekly market outlook is also posted on Facebook and Linkedin.

You can check out how well (or poorly) the outlook has tracked the market using past performance estimates:

For the detailed Elliott Wave Analysis, go to the ELLIOTT WAVE lives on by Tony Caldaro. Charts provided courtesy of stockcharts.com.


Return from Stock Market Outlook 2018-03-11 to Tracking the Stock Market

Return to Invest-Safely.com

Sunday, March 4, 2018

Weekend Stock Market Outlook

Stock Market Outlook For The Week of
March 4th = Downtrend

INDICATORS

20/50 Day Moving Averages: Downtrend
Price & Volume Action: Downtrend
Objective Elliott Wave Analysis: Uptrend

COMMENTARY

Friday's strong rally wasn't enough to recover from them mid-week sell-off, putting the market outlook back in downtrend territory to start this week. Plans for tariffs on steel and aluminum, and talk of the resulting trade-war didn't do the investors any favors either.

We saw the Nasdaq retake the 50 day last week, but the other indexes weren't so lucky. A majority of the indexes start this week below the 20 and 50 day moving averages, so the signal changes to a downtrend.

Price charts for $SPX,$COMPQ,$INDU,$NYA,$RUT,$VIX,$TNX,$USD,$CRB,$GOLD

2018-03-04-US Stock Market Averages

Price and volume action also switches to a downtrend. Tuesday, Wednesday, and Thursday were distribution days, with markets falling on sequentially higher trading volume; a clear sign of institutional selling. Breakouts continue to struggle.

OEW continues to see an uptrend, but doesn't exclude the possibility that stock prices retest the February lows.


If you find this research helpful, please tell a friend. If you don't find it helpful, tell an enemy. I share articles and other news of interest via Twitter; you can follow me @investsafely. The weekly market outlook is also posted on Facebook and Linkedin.

You can check out how well (or poorly) the outlook has tracked the market using past performance estimates:

For the detailed Elliott Wave Analysis, go to the ELLIOTT WAVE lives on by Tony Caldaro. Charts provided courtesy of stockcharts.com.


Return from Stock Market Outlook 2018-03-04 to Tracking the Stock Market

Return to Invest-Safely.com