Stock Market Outlook For The Week of
October 29th = Uptrend
INDICATORS
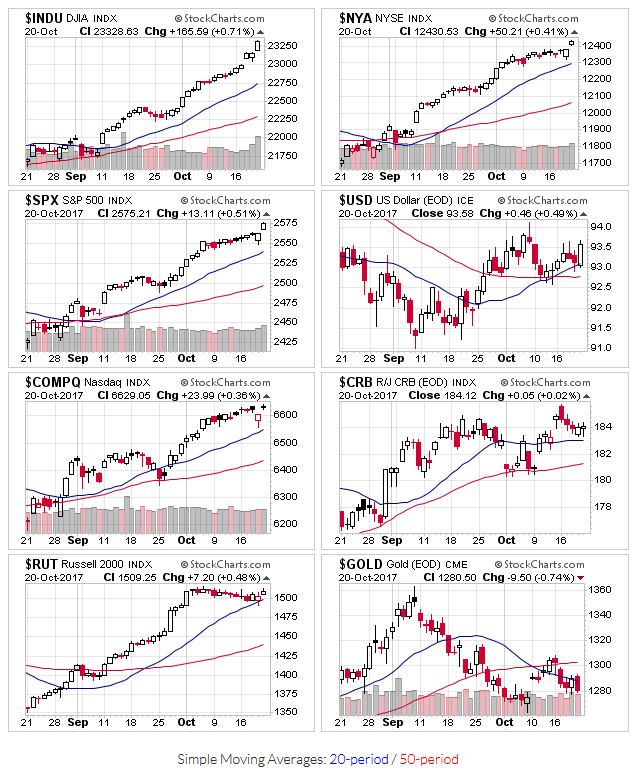
20/50 Day Moving Averages: Uptrend
Price & Volume Action: Uptrend
Objective Elliott Wave Analysis: Uptrend
Another week, and no change in signals...definitely feels like complacency has set in. But feelings are hard to trade profitably, and the positive trends remain intact. U.S. markets continue to grind higher. Volatility has picked up a bit over the past couple weeks, but is still low by all accounts.
U.S. market averages remain above their 20 and 50 day moving averages.

2017-10-29-US Stock Market Averages
Price and volume action is good, thought most leaders are in profit taking zones (>20% from buy points). Now is a great time to book some gains and let the rest ride until sell signals pop up.
OEW remains in an uptrend and estimates 10% more upside before we see a meaningful correction.
If you find this research helpful, please tell a friend. I share articles and other news of interest via Twitter; you can follow me @investsafely. The weekly market outlook is also posted on Facebook and Linkedin.
You can check out how well (or poorly) the outlook has tracked the market using past performance estimates:
For the detailed Elliott Wave Analysis, go to the ELLIOTT WAVE lives on by Tony Caldaro. Charts provided courtesy of stockcharts.com.
Return from Stock Market Outlook 2017-10-29 to Tracking the Stock Market