Stock Market Outlook For The Week of
September 24th = Uptrend
INDICATORS
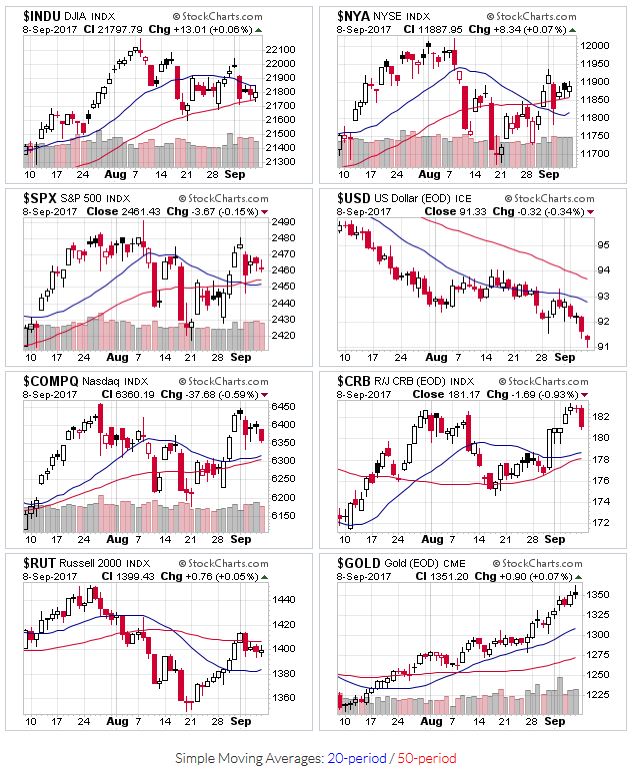
20/50 Day Moving Averages: Uptrend
Price & Volume Action: Uptrend
Objective Elliott Wave Analysis: Uptrend
The market signals are still coming up green, with no changes to the overall signal set. What I can I say? Low volatility (measured by the $VIX) and falling dollar make for boring updates to the market outlook.
All the indexes remain above their 20 and 50 day moving averages to kick off the week.

2017-09-24-US Stock Market Averages
Distribution days continue to drop off the count, putting the indexes in more "robust" territory. The Russell 2000 has staged an impressive climb since hitting its 200 day moving average, showcasing leadership from small caps (a positive sign). Also, more leading stocks broke out last week; trading volume has been just good enough.
OEW continues to show an uptrend in progress.
If you find this research helpful, please tell a friend. I share articles and other news of interest via Twitter; you can follow me @investsafely. The weekly market outlook is also posted on Facebook and Linkedin.
You can check out how well (or poorly) the outlook has tracked the market using past performance estimates:
For the detailed Elliott Wave Analysis, go to the ELLIOTT WAVE lives on by Tony Caldaro. Charts provided courtesy of stockcharts.com.
Return from Stock Market Outlook 2017-09-24 to Tracking the Stock Market
Return to Invest-Safely.com