Sunday, December 30, 2018

Weekend Stock Market Outlook

Stock Market Outlook For The Week of
December 30th = Downtrend

INDICATORS

20/50 Day Moving Averages: Downtrend
Price & Volume Action: Downtrend
Objective Elliott Wave Analysis: Downtrend

COMMENTARY

Better late than never? We had to wait until after Christmas, but Santa Claus delivered a rally. Not as much as we would have liked, I'm sure, but better than another sell-off. No change in outlook though. Equities have some work to do before giving the all clear to put your money at risk.

On the bright side, I don't think we're in danger of a 2008-2009 style sell off just yet (see last week's article "Great Recession Revisited"), so your portfolios should recover a bit.

All the indexes are well below their 20, 50, and 200 day moving averages.

Price charts for $SPX,$COMPQ,$INDU,$NYA,$RUT,$VIX,$TNX,$USD,$CRB,$GOLD

2018-12-30 - US Stock Market Averages

The price/volume combo remains in a downtrend as well. There are only a handful of names on my growth stock list that have anything even close to resembling a solid price chart.

OEW still calls for a downtrend, and thinks we could take another run at the lows. But, per their analysis, that could be the end of the downtrend...even the bear market(!).

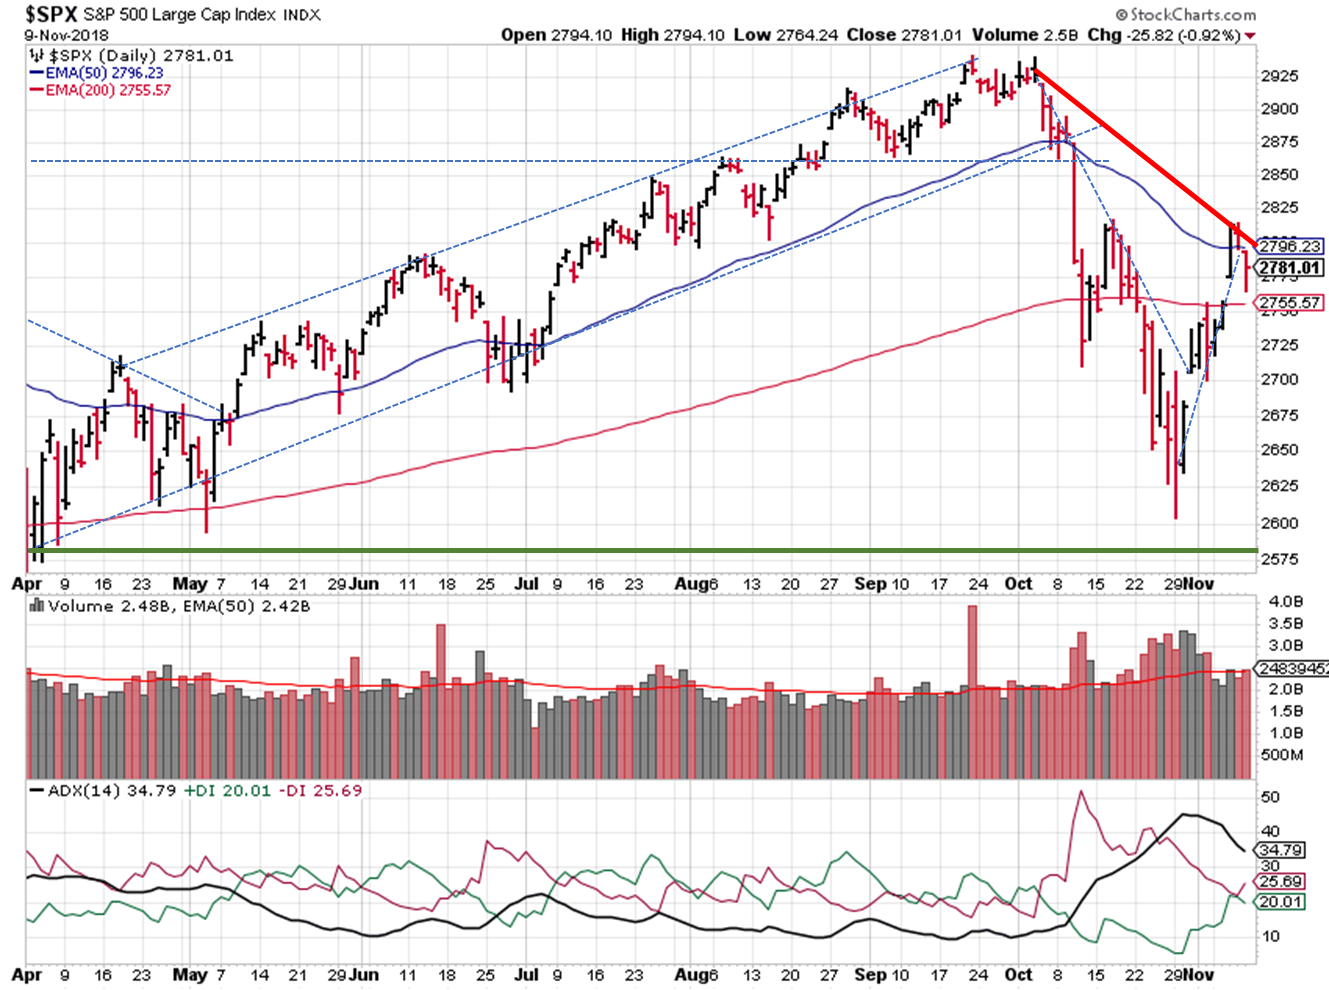
The S&P ($SPX) found support around 2,350, and looks to have broken the falling trendline in play for most of December. Prices still have to recover ~10% just to get back to the downward trendline and/or 200-day moving average! The ADX reflects the bearish we experienced last week.

2018-12-30 - $SPX Technical Analysis - Daily

2018-12-30 - SPX Technical Analysis - Daily

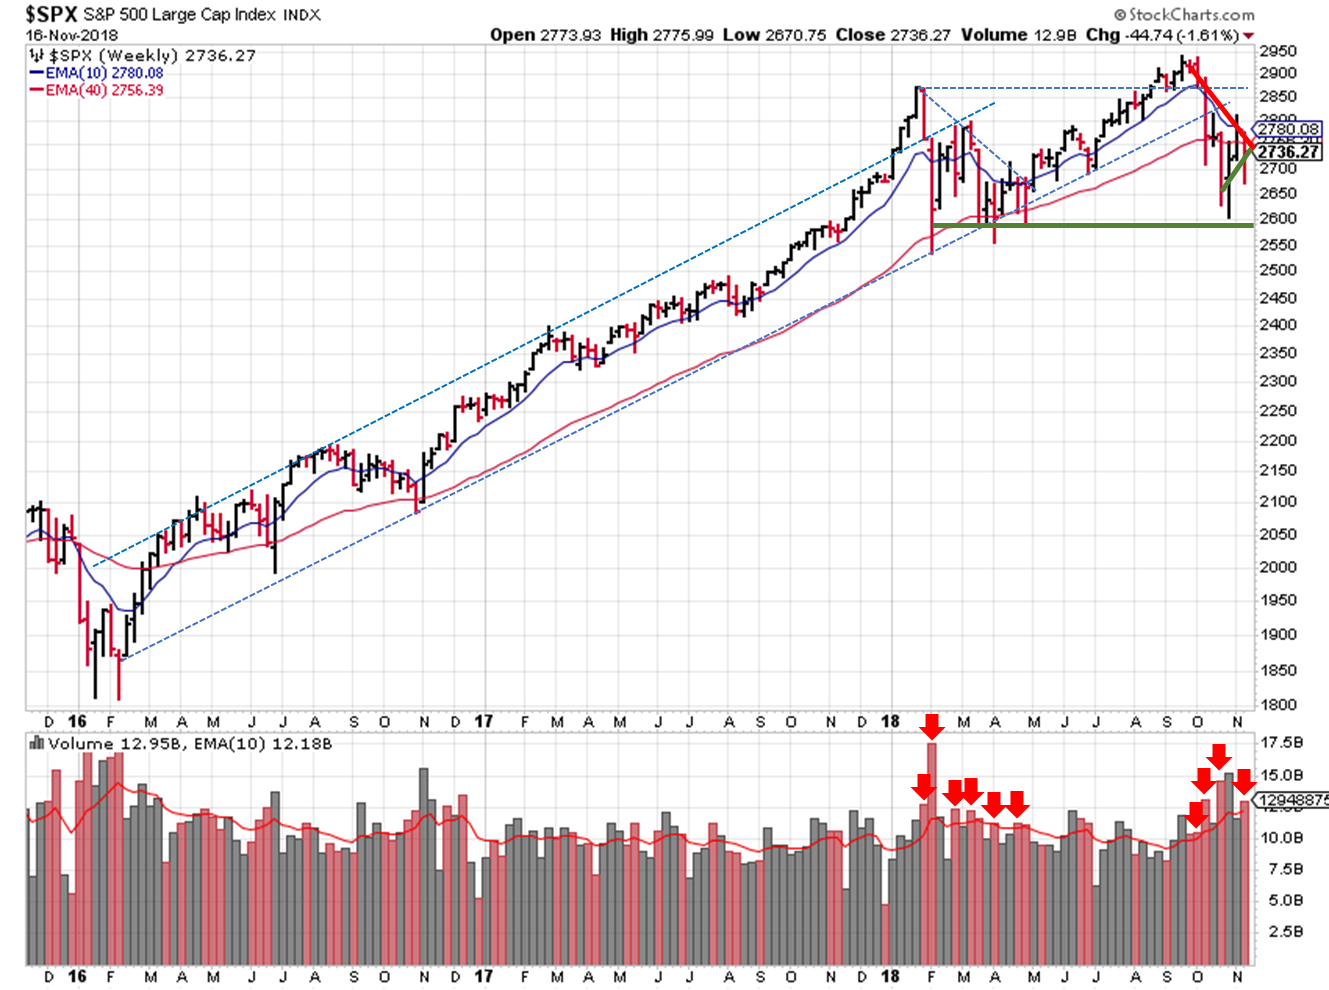
Switching to a weekly view, the 2395 support level held and prices are resting on the 2480 support/resistance level.

2018-12-30 - $SPX Technical Analysis - Weekly

2018-12-30 - SPX Technical Analysis - Weekly

After the bounce back, bulls will say we're a week into a V-shaped recovery. The bears will say we need another test of the lows to truly bottom. Our job is to make money or not to lose a lot if we decide to initiate positions.

We've got another holiday shortened trading week coming up as we celebrate the new year.

Wishing you investing success in 2019!

Happy New Year!


If you find this research helpful, please tell a friend. If you don't find it helpful, tell an enemy. I share articles and other news of interest via Twitter; you can follow me @investsafely. The weekly market outlook is also posted on Facebook and Linkedin.

You can check out how well (or poorly) the outlook has performed as a stand-alone, signal generator using past performance estimates:

For the detailed Elliott Wave Analysis, go to the ELLIOTT WAVE lives on by Tony Caldaro. Charts provided courtesy of stockcharts.com.


  1. Invest-Safely.com
  2. >>
  3. Tracking the Stock Market
  4. >>
  5. Stock Market Outlook for 2018-12-30

Sunday, December 23, 2018

Weekend Stock Market Outlook

Stock Market Outlook For The Week of
December 23rd = Downtrend

INDICATORS

20/50 Day Moving Averages: Downtrend
Price & Volume Action: Downtrend
Objective Elliott Wave Analysis: Downtrend

COMMENTARY

Investors say that prices take the stairs on the way up, and the escalator on the way down.  I think the market opted for the elevator this month.  But there's still hope; the Santa Claus rally (sustained increases in the stock market that begin on December 26th and extend through January 2nd) is still on the table.

All the indexes are WAY below their 20, 50, and 200 day moving averages.

Price charts for $SPX,$COMPQ,$INDU,$NYA,$RUT,$VIX,$TNX,$USD,$CRB,$GOLD

2018-12-23 - US Stock Market Averages

The price/volume combo remains in a downtrend as well.  Volume rose during the week, then exploded Friday. The quadruple witching day (market index futures, market index options, stock options and stock futures expired) at the end of the last full trading week in 2018 was the main catalyst.

OEW (downtrend) saw last week expected support level wiped out by falling prices:

    There were three Fibonacci retracement levels for support..: (38.2%) 2509, (50.0%) 2376, and (61.8%) 2242. Obviously the first one did not hold. Our worse case support has been around SPX 2400, which is also close to the 50% retracement...

On to some trendlines. Sadly, there was no bounce back to the recent trading range, nor was there a floor at 2580 from early 2018.  The S&P ($SPX) fell to prices we haven't seen in over a year (August 2017).  Now we need to go back almost 2 years to see where we might bottom...elevator indeed.

2018-12-23 - $SPX Technical Analysis - Daily

2018-12-23 - SPX Technical Analysis - Daily

There was support around 2480, which would have been a 16% correction. Next up is 2395 (similar to the OEW viewpoint), then we go down to 2276, and then on to 2184. Those levels represent 19%, 23%, and 26% declines from the all time of 2940, respectively.

2018-12-23 - $SPX Technical Analysis - Weekly

2018-12-23 - SPX Technical Analysis - Weekly

Right now, the SPX is ~18% from the September high, which is the largest correction since 2011 (~20%).  Not quite bear market territory, but close...no wonder the twitterverse is losing its collective mind.

To be fair, we haven't seen many corrections since 2009.  And when we did see a drop, it was typically V-shaped with prices rebounding quickly.  So it's rational to think these moves to the downside are abnormal. They're not.

2018-12-23 - $SPX vs 200 SMA


Historically, stocks look really oversold right now. Could they go lower and be more oversold? Of course. Either way, last week's action is a fantastic opportunity to review your buy and sell rules. When the markets are "always" in an uptrend, it's easy to lose discipline and not get burned. Even when the markets move sideways, investors don't want to "trade", so they ignore signals and wait for a rebound.

We're not in a recession just yet, so a v-shaped recovery wouldn't surprise me. Maybe the executive and legislative branches will act like adults, reach an agreement, end the government shutdown, and the Santa Claus rally will come to town.  Now that would be a Christmas miracle.

We have a short, low volume trading week ahead, with partial session Monday (Christmas Eve) and no trading on Tuesday (Christmas Day). A great time to log out of StockTwits, turn off CNBC, and relax!

Warmest wishes and a joy filled holiday week to you and your family.

Merry Christmas!


If you find this research helpful, please tell a friend. If you don't find it helpful, tell an enemy. I share articles and other news of interest via Twitter; you can follow me @investsafely. The weekly market outlook is also posted on Facebook and Linkedin.

You can check out how well (or poorly) the outlook has performed as a stand-alone, signal generator using past performance estimates:

For the detailed Elliott Wave Analysis, go to the ELLIOTT WAVE lives on by Tony Caldaro.  Charts provided courtesy of stockcharts.com.


  1. Invest-Safely.com
  2. >>
  3. Tracking the Stock Market
  4. >>
  5. Stock Market Outlook for 2018-12-23

Sunday, December 16, 2018

Weekend Stock Market Outlook

Stock Market Outlook For The Week of
December 16th = Downtrend

INDICATORS

20/50 Day Moving Averages: Downtrend
Price & Volume Action: Downtrend
Objective Elliott Wave Analysis: Downtrend

COMMENTARY

So far, Santa hasn't come to our rescue with his rally yet. Investors are probably rethinking those GI Joe's with the kung-fu grips (if you don't know that line, the movie Trading Spaces would make an excellent last minute gift).

All the indexes are still below their 20, 50, and 200 day moving averages to start this week.

Price charts for $SPX,$COMPQ,$INDU,$NYA,$RUT,$VIX,$TNX,$USD,$CRB,$GOLD

2018-12-16 - US Stock Market Averages

The price/volume combo remains in a downtrend as well. Trading volumes were just about average across the week, but institutions still appear to be in sell mode.

OEW continues with the probable downtrend call, while looking for the SPX to find support at 2577 or even 2550.

The S&P ($SPX) closed at 2599.95 last week, falling below the 2630 support level we've been watching. Friday was also the first time the SPX closed below 2630 since April! A bounce-back on Monday would salvage the sideways trading range, but for now it looks done and dusted.

2018-12-16 - $SPX Technical Analysis - Daily

2018-12-16 - SPX Technical Analysis - Daily

The 2580 support level, which was established way back between February and April, is now in play...which coincides with the OEW target mentioned earlier.

2018-12-16 - $SPX Technical Analysis - Weekly

2018-12-16 - SPX Technical Analysis - Weekly

Not much we can do right now on the long side for growth strategies. Fingers crossed and stops tight if you do decide to brave the waters. For income strategies, some utilities have been doing really well recently, but that's about it. The good news is that P/E ratios are beginning to come down. When the market turns around, there will be some solid names for sale.

Participate. Protect. Prepare.


If you find this research helpful, please tell a friend. If you don't find it helpful, tell an enemy. I share articles and other news of interest via Twitter; you can follow me @investsafely. The weekly market outlook is also posted on Facebook and Linkedin.

You can check out how well (or poorly) the outlook has performed as a stand-alone, signal generator using past performance estimates:

For the detailed Elliott Wave Analysis, go to the ELLIOTT WAVE lives on by Tony Caldaro. Charts provided courtesy of stockcharts.com.


  1. Invest-Safely.com
  2. >>
  3. Tracking the Stock Market
  4. >>
  5. Stock Market Outlook for 2018-12-16

Sunday, December 9, 2018

Weekend Stock Market Outlook

Stock Market Outlook For The Week of
December 9th = Downtrend

INDICATORS

20/50 Day Moving Averages: Downtrend
Price & Volume Action: Downtrend
Objective Elliott Wave Analysis: Downtrend

COMMENTARY

Yikes. Just when things started looking brighter, U.S. equities sold off...hard. One week after the switch to an uptrend, the outlook sours and reverts to a downtrend, with confirmation from all 3 signals.

All the indexes start this week below their 20 day moving averages, sending this signal back to a downtrend. They're all below their 200-day moving averages as well.

Price charts for $SPX,$COMPQ,$INDU,$NYA,$RUT,$VIX,$TNX,$USD,$CRB,$GOLD

2018-12-09 - US Stock Market Averages

In almost a complete 180 from last week, the price/volume signal switches back to a downtrend signal. Last week's losses came on higher trading volume...not the kind of price action that supports an uptrend. Strong fundamental performance didn't provide shelter from the storm either. Lululemon reported Q3 results Thursday, beating top and bottom line estimates and maintaining their future outlook. The result? Opened Friday at $132, closed at $113 and change...down 14% for the week.

OEW switched back to a downtrend. Even Tony commented on the difficulty identifying trends given the current market conditions and gyrations.

The S&P ($SPX) wiped out two trendlines last week; the short term uptrend, and the intermediate downtrend. If you squint and give yourself some wiggle room, it almost looks like the SPX is range-bound between 2810 and 2630. Prices ended the week at 2633.

2018-12-09 - $SPX Technical Analysis - Daily

2018-12-09 - SPX Technical Analysis - Daily

Longer term, 2600 (give or take a couple percentage points) has served as the floor of support most of 2018. If it doesn't hold, look for a new downward price channel to develop. Since the stock markets were closed on Wednesday, we didn't add another week of high volume selling.

2018-12-09 - $SPX Technical Analysis - Weekly

2018-12-09 - SPX Technical Analysis - Weekly

You may have heard about the yield curve inversion last week. Normally, more uncertainty exists over longer time periods, which brings higher risk, which requires higher yield to compensate. An inversion means an expectation of higher risk in the short term.

Yield Curve Examples - 2018-12-09

Yield Curve Examples - 2018-12-09

In this case, the short end of the yield curve (3 and 5 year yields) inverted slightly, meaning the yield on the 3 year was higher than the 5 year. Before you head for the hills, true inversion, the kind that preceded every recession in the past 60 years or so, occurs when the short end (1 year) is higher than the long end (10+ year). Even then, a recession starts anytime from 6 to 24 months after an inversion event. And here's a silver lining. Per The Fat Pitch:

    "SPX normally gains over the next 3 and 9 months after the first 5-3 inversion of the cycle (from Troy Bombardia; note that 1973 was the year of the oil embargo)."

So you've got some time to get things in order. It's pretty typical bear market price action actually, but that means admitting and accepting we're in one. One thing we can all agree on...it's a traders market.

Participate. Protect. Prepare.


If you find this research helpful, please tell a friend. If you don't find it helpful, tell an enemy. I share articles and other news of interest via Twitter; you can follow me @investsafely. The weekly market outlook is also posted on Facebook and Linkedin.

You can check out how well (or poorly) the outlook has performed as a stand-alone, signal generator using past performance estimates:

For the detailed Elliott Wave Analysis, go to the ELLIOTT WAVE lives on by Tony Caldaro. Charts provided courtesy of stockcharts.com.


  1. Invest-Safely.com
  2. >>
  3. Tracking the Stock Market
  4. >>
  5. Stock Market Outlook for 2018-12-09

Sunday, December 2, 2018

Weekend Stock Market Outlook

Stock Market Outlook For The Week of
December 2nd = Uptrend

INDICATORS

20/50 Day Moving Averages: Mixed
Price & Volume Action: Uptrend
Objective Elliott Wave Analysis: Uptrend

COMMENTARY

A change in language from Fed chair Powell put big investors back in buy mode, and the market rallied from there. At the G-20 summit this weekend, the U.S. and China agreed to start negotiations and ease trade tensions, with the U.S. postponing plans to increase tariffs on Chinese goods. A solid week of trading, the perception of a more accommodating Fed, and a temporary reprieve from tariffs puts the markets back in an uptrend, just in time for the annual Santa Claus rally.

All the indexes start this week above their 20 day moving averages. And their all fairly close to, if not right above, their 50 day moving averages. So this signal moves from downtrend to mixed.

Price charts for $SPX,$COMPQ,$INDU,$NYA,$RUT,$VIX,$TNX,$USD,$CRB,$GOLD

2018-12-02 - US Stock Market Averages

The price/volume signal switches back to an uptrend signal, with last week's gains coming on higher trading volume. Growth stocks have had 6-8 weeks to build new bases, so this is about the time you'd want to see new breakouts from names that held up well during the sell-off. Time to check those buy lists!

OEW switched to an uptrend. It appears they ~2 weeks early in the call for an uptrend...a common issue when trying to call a trend change.

The S&P ($SPX) found its footing, looks set to give us that Santa Claus rally to close out the year. Prices broke through the second leg down (after failing to do so on the 19th. The index also closed just above the October/November downtrend, another positive sign in line with the uptrend generated by the signals above. The ADX isn't quite there yet, but is trending in the right direction (DI- coming down, DI+ rising, and the weakening bearish trend).

2018-12-02 - $SPX Technical Analysis - Daily

2018-12-02 - SPX Technical Analysis - Daily

Looking back of the past few weeks, you can see the back and forth between uptrends and downtrends in each of the signals. This is one reason to use more than one signal in your trading process. It's not perfect, but the odds of success are higher...or the odds of being wrong and losing money are lower, if you have your safe investing hat on.

Participate. Protect. Prepare.


If you find this research helpful, please tell a friend. If you don't find it helpful, tell an enemy. I share articles and other news of interest via Twitter; you can follow me @investsafely. The weekly market outlook is also posted on Facebook and Linkedin.

You can check out how well (or poorly) the outlook has performed as a stand-alone, signal generator using past performance estimates:

For the detailed Elliott Wave Analysis, go to the ELLIOTT WAVE lives on by Tony Caldaro. Charts provided courtesy of stockcharts.com.


  1. Invest-Safely.com
  2. >>
  3. Tracking the Stock Market
  4. >>
  5. Stock Market Outlook for 2018-12-02

Sunday, November 25, 2018

Weekend Stock Market Outlook

Stock Market Outlook For The Week of
November 25th = Downtrend

INDICATORS

20/50 Day Moving Averages: Downtrend
Price & Volume Action: Downtrend
Objective Elliott Wave Analysis: Downtrend

COMMENTARY

Investors didn't display much holiday cheer during the short trading week in the US. So much for my thought that we'd head back to the 50-day moving average last week...just another example of why it's so important to stick with clearly defined buy and sell rules.

All the indexes start the week back below their 20 and 50 day moving averages.

Price charts for $SPX,$COMPQ,$INDU,$NYA,$RUT,$VIX,$TNX,$USD,$CRB,$GOLD

2018-11-25- US Stock Market Averages

The price/volume signal switches to a mixed signal The price/volume signal switches to a downtrend signal after taking out the October lows. As mentioned last week, it wasn't a strong uptrend to begin with, so a change isn't so surprising.

OEW is back to a downtrend, as the uptrend within the overall downtrend appears to have completed already (versus last week's statement that a rally to +2800 was in the cards).

The S&P ($SPX) gapped down last week, breaking through a fledgling trendline and eventually closing out the week below the October low. The closing price wasn't too far way from that mark, so support around 2640 is still a possibility.

2018-11-25 - $SPX Technical Analysis - Daily

2018-11-25 - SPX Technical Analysis - Daily

In the weekly view, the S&P confirmed the downtrend last week.

2018-11-25 - $SPX Technical Analysis - Weekly

2018-11-25 - SPX Technical Analysis - Weekly

Hopefully you stayed conservative last week and enjoyed some Thanksgiving feasting.

Participate. Protect. Prepare.


If you find this research helpful, please tell a friend. If you don't find it helpful, tell an enemy. I share articles and other news of interest via Twitter; you can follow me @investsafely. The weekly market outlook is also posted on Facebook and Linkedin.

You can check out how well (or poorly) the outlook has performed as a stand-alone, signal generator using past performance estimates:

For the detailed Elliott Wave Analysis, go to the ELLIOTT WAVE lives on by Tony Caldaro. Charts provided courtesy of stockcharts.com.


  1. Invest-Safely.com
  2. >>
  3. Tracking the Stock Market
  4. >>
  5. Stock Market Outlook for 2018-11-25

Sunday, November 18, 2018

Weekend Stock Market Outlook

Stock Market Outlook For The Week of
November 18th = Downtrend

INDICATORS

20/50 Day Moving Averages: Downtrend
Price & Volume Action: Mixed
Objective Elliott Wave Analysis: Mixed

COMMENTARY

A difficult week to judge. In the end, preserving capital is key and caution is the name of the game right now.

This week starts with major indexes back below their 50-day moving averages. Most fell below their 20-day moving averages last week as well, but were able to recover by the close on Friday... the lone exception being the NASDAQ.

Price charts for $SPX,$COMPQ,$INDU,$NYA,$RUT,$VIX,$TNX,$USD,$CRB,$GOLD

2018-11-18- US Stock Market Averages

The price/volume signal switches to a mixed signal because we picked up a couple distribution days and we weren't able to hold a key moving averages (200 day). Neither of which is what you want to see early in an uptrend. Also, the best performing stocks aren't exactly "growth stocks" (car parts, retail, drug stores).

OEW indicates an uptrend within the overall downtrend. So far, OEWs expectation for a sell off to ~2,700 was the right call, as prices found support at that level on Wednesday and Thursday. If the analysis holds, a rally to +2800 will follow over the next few weeks, before we fall again towards 2,400.

The S&P ($SPX) couldn't hold its 200 day moving average, and retreated last week. In the process, it "filled" both gap ups in the recent uptrend. There was price support around ~2,700, as OEW expected.

2018-11-18 - $SPX Technical Analysis - Daily

2018-11-18 - SPX Technical Analysis - Daily

Looking at the long-term picture, the S&P should confirm the uptrend or downtrend this week...unless it moves completely sideways and closes at the same price as last week.

2018-11-18 - $SPX Technical Analysis - Weekly

2018-11-18 - SPX Technical Analysis - Weekly

To summarize, the moving averages didn't provide much support last week, so the downtrend signal remains in place. The price/volume indicator shifted to from uptrend to mixed. OEW is still mixed, but shows a short-term uptrend within the overall downtrend. You could argue that the price/volume indicator has an uptrend bias since it hasn't shown an outright downtrend yet. And OEW could be interpreted as an uptrend for the near term. This interpretation would show 2 of the 3 signals in uptrend mode, and initiate a trend change.

So what to do? My expectation is that we rally higher from here. We may even get back above the 50-day moving average, which would shift the overall signal back to an uptrend...albeit missing out on a ~2% price increase. The characteristics of the market are different (volatility, etc.), so you need to make sure your signals are appropriate. Keep your losses small, and don't be in a hurry to initiate large positions.

Participate. Protect. Prepare.


If you find this research helpful, please tell a friend. If you don't find it helpful, tell an enemy. I share articles and other news of interest via Twitter; you can follow me @investsafely. The weekly market outlook is also posted on Facebook and Linkedin.

You can check out how well (or poorly) the outlook has performed as a stand-alone, signal generator using past performance estimates:

For the detailed Elliott Wave Analysis, go to the ELLIOTT WAVE lives on by Tony Caldaro. Charts provided courtesy of stockcharts.com.


  1. Invest-Safely.com
  2. >>
  3. Tracking the Stock Market
  4. >>
  5. Stock Market Outlook for 2018-11-18

Sunday, November 11, 2018

Weekend Stock Market Outlook

Stock Market Outlook For The Week of
November 11th = Downtrend

INDICATORS

20/50 Day Moving Averages: Downtrend
Price & Volume Action: Uptrend
Objective Elliott Wave Analysis: Mixed

COMMENTARY

Investors like the results of mid-term elections in the US. No political party in total control usually results in gridlock, which mean businesses focus on business. Investors didn't like the outcome from the Fed meeting as much, with likely rate increase in December and expectations for 3 more in 2019.

With the exception of the Dow Jones Industrials, all the indexes continue to trade below their 20 and 50 day moving averages, so no signal change yet.

Price charts for $SPX,$COMPQ,$INDU,$NYA,$RUT,$VIX,$TNX,$USD,$CRB,$GOLD

2018-11-11- US Stock Market Averages

The price/volume signal confirmed an uptrend last week as the indexes jumped back above their 200 day moving averages. Trading volume wasn't REALLY great and we're still below the 50-day moving averages for the most part. So it appears to be more of a recovery rally after the fierce selling, reminiscent of earlier this year, rather than a new bull market.

OEW called for a probable uptrend, within the overall downtrend. The expectation is for the S&P to sell off a bit to ~2,700, rally higher, then fall again towards 2,400.

The S&P ($SPX) cleared the 200 day moving average, but then ran into resistance around 2800.

2018-11-11 - $SPX Technical Analysis - Daily

2018-11-11 - SPX Technical Analysis - Daily

Again, use your process to determine what and when to buy or sell. Participate. Protect. Prepare.


If you find this research helpful, please tell a friend. If you don't find it helpful, tell an enemy. I share articles and other news of interest via Twitter; you can follow me @investsafely. The weekly market outlook is also posted on Facebook and Linkedin.

You can check out how well (or poorly) the outlook has performed as a stand-alone, signal generator using past performance estimates:

For the detailed Elliott Wave Analysis, go to the ELLIOTT WAVE lives on by Tony Caldaro. Charts provided courtesy of stockcharts.com.


  1. Invest-Safely.com
  2. >>
  3. Tracking the Stock Market
  4. >>
  5. Stock Market Outlook for 2018-11-11

Sunday, November 4, 2018

Weekend Stock Market Outlook

Stock Market Outlook For The Week of
November 4th = Downtrend

INDICATORS

20/50 Day Moving Averages: Downtrend
Price & Volume Action: Downtrend
Objective Elliott Wave Analysis: Downtrend

COMMENTARY

Prices for U.S. stocks bounced and indexes finished up for the week. With midterm elections Tuesday, it's anyone's guess how market prices will respond with the votes are tallied. And we have a Fed meeting this week.

All the indexes continue to trade at or below their 20 and 50 day moving averages, keeping this signal in a downtrend.

Price charts for $SPX,$COMPQ,$INDU,$NYA,$RUT,$VIX,$TNX,$USD,$CRB,$GOLD

2018-11-04 - US Stock Market Averages

The price/volume signal remains in a downtrend. Now that the indexes have rallied a bit, start looking for a follow-through day (1.5% gain on higher than average trading volume), which would change this signal back to an uptrend. Thursday was close, but couldn't pull through.

OEW maintains a downtrend signal, but:

    "the decline from SPX 2941 to 2604 might have ended the first downtrend...and a potential...uptrend is now underway."

The S&P ($SPX) appears to have bottomed just above 2600. On Friday, prices tested the 200 day moving average.

2018-11-04 - $SPX Technical Analysis - Daily

2018-11-04 - SPX Technical Analysis - Daily

Last week we mentioned a change in the character of the market, in terms of volatility. I received an email asking how to visualize that "change". Many people use the VIX (see above). But if you're looking for something more specific to the index or stock you're following, try the Average True Range indicator; I actually calculate within one of my mechanical trading systems.

2018-11-04 - $SPX Technical Analysis - Weekly

2018-11-04 - SPX Technical Analysis - Weekly

My opinion is still that the SPX will test support around 2581, but now it appears it will claw back some of the decline first. We could even see 2875 before selling off again. I imagine the price action could look similar to what occurred between the February and April lows.

Again, use your process to determine what and when to buy or sell. Per OEW:

    "...the four major US indices have not confirmed bear markets yet. We may not see a bear market confirmation in the US until the bear market is nearly over. That’s what happened in 2016, and is part of the reason we were caught off guard at that low."

Participate. Protect. Prepare.


If you find this research helpful, please tell a friend. If you don't find it helpful, tell an enemy. I share articles and other news of interest via Twitter; you can follow me @investsafely. The weekly market outlook is also posted on Facebook and Linkedin.

You can check out how well (or poorly) the outlook has performed as a stand-alone, signal generator using past performance estimates:

For the detailed Elliott Wave Analysis, go to the ELLIOTT WAVE lives on by Tony Caldaro. Charts provided courtesy of stockcharts.com.


  1. Invest-Safely.com
  2. >>
  3. Tracking the Stock Market
  4. >>
  5. Stock Market Outlook for 2018-11-04

Sunday, October 28, 2018

Weekend Stock Market Outlook

Stock Market Outlook For The Week of
October 28th = Downtrend

INDICATORS

20/50 Day Moving Averages: Downtrend
Price & Volume Action: Downtrend
Objective Elliott Wave Analysis: Downtrend

COMMENTARY

The 200 day moving average was the latest support level to fall in what is a REALLY red October. The only good news seems to be that everyone thinks the markets are way oversold and should bounce from the current levels. But isn't the consensus usually wrong? Remember to follow your buy and sell rules, not the talking heads. When the selling is over, there will be great buying opportunities.

All the indexes continue to trade below their 20 and 50 day moving averages, keeping this signal in a downtrend.

Price charts for $SPX,$COMPQ,$INDU,$NYA,$RUT,$VIX,$TNX,$USD,$CRB,$GOLD

2018-10-28 - US Stock Market Averages

Since prices continue to fall on higher than average volume, the price/volume signal remains in a downtrend too.

OEW also continues with a downtrend signal. They're also stating that we're very oversold, and expect a brief rally in the near term.

The S&P ($SPX) fell well below the 200 day moving average last week. The character of the US markets has shifted during October and from the chart you can clearly see the old adage in action; prices take the stairs on their way up and the elevator on their way down. More than likely we'll see a test of the April low price level within the next two weeks or so.

2018-10-28 - $SPX Technical Analysis - Daily

2018-10-28 - SPX Technical Analysis - Daily

Expanding the view, you can see that January 2016 was last time the SPX closed substantially below the 200 day / 40 week moving average. At some point, the lower stock prices will bring in big institutions...so watch for trading volume cues.

2018-10-28 - $SPX Technical Analysis - Weekly

2018-10-28 - SPX Technical Analysis - Weekly

I took my own advice and checked my watch list. It wasn't pretty. But there are a few names that have held up well, relative to the overall market. And those names are the ones I'm watching closely for signs that the selling is complete.

Participate. Protect. Prepare.


If you find this research helpful, please tell a friend. If you don't find it helpful, tell an enemy. I share articles and other news of interest via Twitter; you can follow me @investsafely. The weekly market outlook is also posted on Facebook and Linkedin.

You can check out how well (or poorly) the outlook has performed as a stand-alone, signal generator using past performance estimates:

For the detailed Elliott Wave Analysis, go to the ELLIOTT WAVE lives on by Tony Caldaro. Charts provided courtesy of stockcharts.com.


  1. Invest-Safely.com
  2. >>
  3. Tracking the Stock Market
  4. >>
  5. Stock Market Outlook for 2018-10-28

Sunday, October 21, 2018

Weekend Stock Market Outlook

Stock Market Outlook For The Week of
October 21st = Downtrend

INDICATORS

20/50 Day Moving Averages: Downtrend
Price & Volume Action: Downtrend
Objective Elliott Wave Analysis: Downtrend

COMMENTARY

We start this week sitting on a small, fledgling recovery within a downtrend. The 200 day moving average provided some level of support, but it's not clear if this is the start of a rally or a pause in the downtrend.

All the indexes kick things off below their 20 and 50 day moving averages, keeping this signal in a downtrend.

Price charts for $SPX,$COMPQ,$INDU,$NYA,$RUT,$VIX,$TNX,$USD,$CRB,$GOLD

2018-10-21 - US Stock Market Averages

The downtrend remains from a price/volume perspective, as leading stocks continue to get trounced and prices continue to fall on higher than average trading volume.

OEW remains in a downtrend. They expected a 250 point decline, followed by a 50% retracement, and then another decline to lower lows. Last week, we recovered just under 50% of the first drop (~110 of the 230 points).

The S&P ($SPX) found support at the 200 day moving average during the week, but didn't progress much from that level either. If that level doesn't hold, a trip below 2600 is likely (losses of another 6% or so).

2018-10-21 - $SPX Technical Analysis - Daily

2018-10-21 - SPX Technical Analysis - Daily

2018-10-21 - $SPX Technical Analysis - Weekly

2018-10-21 - SPX Technical Analysis - Weekly

Now is not the time to go all in; we need some positive developments first. But take a look at your watch list and see what's holding up reasonable well in the midst of the sell-off. Those are likely the names that will lead the market higher when it turn around.

Participate. Protect. Prepare.


If you find this research helpful, please tell a friend. If you don't find it helpful, tell an enemy. I share articles and other news of interest via Twitter; you can follow me @investsafely. The weekly market outlook is also posted on Facebook and Linkedin.

You can check out how well (or poorly) the outlook has performed as a stand-alone, signal generator using past performance estimates:

For the detailed Elliott Wave Analysis, go to the ELLIOTT WAVE lives on by Tony Caldaro. Charts provided courtesy of stockcharts.com.


  1. Invest-Safely.com
  2. >>
  3. Tracking the Stock Market
  4. >>
  5. Stock Market Outlook for 2018-10-21

Sunday, October 14, 2018

Weekend Stock Market Outlook

Stock Market Outlook For The Week of
October 14th = Downtrend

INDICATORS

20/50 Day Moving Averages: Downtrend
Price & Volume Action: Downtrend
Objective Elliott Wave Analysis: Downtrend

COMMENTARY

Ugly. Yes, we've grown accustom to low volatility. And yes, we've been seeing and discussing some potential warning signs of the past few weeks. But there's just no way around it...last weeks price drop was ugly. The only silver lining was Friday's price action, and even that wasn't enough to change the inevitable: this week sees a trend change from uptrend to downtrend.

All the indexes start the week below their 20 and 50 day moving averages, putting this signal in a downtrend. The Russell 2000 and NYSE are below their 200 day moving average as well (!), while he S&P, NASDAQ, and DJIA found some support at that level during Friday's trading session.

Price charts for $SPX,$COMPQ,$INDU,$NYA,$RUT,$VIX,$TNX,$USD,$CRB,$GOLD

2018-10-14 - US Stock Market Averages

The big percentage sell-offs on high trading volume and weakness in leading stocks shifts the price/volume signal to a downtrend as well.

OEW puts us in a downtrend too. Per their analysis, the bull market that started in 2016 is over, and we're going to see our first bear market in some time.

    We are now expecting a shallow 15% to 20% bear market lasting several months into next year.
The good news? Peak to trough, we've already seen ~8.5% (or 230 points) of that decline. Again, from OEW:

    In recent years all the selloffs, (2011, 2015/2016, and 2018) have been quite similar...About a 250+ point decline, a 50% retracement, and then a lower low.

Technically speak, the S&P ($SPX) took out most of the near-term support levels last week; the 50 day moving average, the January high, and the lower trendline of the price channel. It's currently testing the 200 day moving average.

The S&P ($SPX) continued to retreat from the price upper channel, but appeared to find support on Friday, after testing key support levels (both the January high and 50-day moving average). If we continue lower this week, the next stop is the lower price channel. The ADX broke out, clearly showing the negative trend in firm command.

2018-10-14 - $SPX Technical Analysis - Daily

2018-10-14 - SPX Technical Analysis - Daily

Moving to the longer term view, the S&P broke the long term trendline that has acted as support all the way back into 2016. This development supports the OEW viewpoint about the end of our 2016 bull market.

2018-10-14 - $SPX Technical Analysis - Weekly

2018-10-14 - SPX Technical Analysis - Weekly

Now we wait to see if the 200 day can provide support like it did in February and April. Usually a dramatic sell-off is followed by a decent rally...one could argue that started on Friday. And we're starting Q3 earnings season, which could bolster prices...as long as trade wars and tariffs aren't used to revise future earnings expectations downward.

Given the fast and furious selling, I'm expecting some additional price recovery in the near term, which I plan to use to my advantage before we head lower again...maybe back to the February low.

Participate. Protect. Prepare.


If you find this research helpful, please tell a friend. If you don't find it helpful, tell an enemy. I share articles and other news of interest via Twitter; you can follow me @investsafely. The weekly market outlook is also posted on Facebook and Linkedin.

You can check out how well (or poorly) the outlook has performed as a stand-alone, signal generator using past performance estimates:

For the detailed Elliott Wave Analysis, go to the ELLIOTT WAVE lives on by Tony Caldaro. Charts provided courtesy of stockcharts.com.


  1. Invest-Safely.com
  2. >>
  3. Tracking the Stock Market
  4. >>
  5. Stock Market Outlook for 2018-10-14

Sunday, October 7, 2018

Weekend Stock Market Outlook

Stock Market Outlook For The Week of
October 7th = Uptrend

INDICATORS

20/50 Day Moving Averages: Downtrend
Price & Volume Action: Mixed
Objective Elliott Wave Analysis: Uptrend

COMMENTARY

Well that didn't last long; the good times didn't even make it through the first week of October! The selloff on Thursday and Friday put a dent in our current rally. We're definitely seeing in the specialized indexes (Nasdaq for technology or the Russell2K for small caps). Two signal changes this week, but the overall market outlook remains in an uptrend for now. A shift to a downtrend signal from either price/volume or OEW would put 2/3 signals in the red and shift the market outlook from uptrend to downtrend. But the S&P is still within the April/May price channel and hasn't broken key support levels, so the uptrend isn't finished yet.

The Nasdaq followed the Russell 2000 lower, falling below it's 50-day moving average. The NYSE sits just below its own 50 day. The S&P500 sits between the 20 and the 50, having found some support at the latter. Only the Dow Jones is above it's 20 and 50. With 3 of the 5 market averages below their 20 and 50-day moving averages, the moving average signal changes to a downtrend.

Price charts for $SPX,$COMPQ,$INDU,$NYA,$RUT,$VIX,$TNX,$USD,$CRB,$GOLD

2018-10-07 - US Stock Market Averages

From a price/volume perspective, we're no longer in an outright uptrend or downtrend. A few indexes are below their 50 days, and the distribution day count remains elevated. Specifically for the S&P, it's still above the 50-day, and distribution days are low. So this signal shifts from uptrend to mixed.

Continuing their theme from last week, OEW says we're in the last innings of an uptrend, expecting one last gasp to higher highs before a true correction takes hold.

The S&P ($SPX) continued to retreat from the price upper channel, but appeared to find support on Friday, after testing key support levels (both the January high and 50-day moving average). If we continue lower this week, the next stop is the lower price channel.

2018-10-07 - $SPX Technical Analysis - Daily

2018-10-07 - SPX Technical Analysis - Daily

The ADX continues to meander around under the "20" level. The DI- overtook the DI+ after the late week sell off, but still no definitive signal either way.

2018-10-07 - $SPX Technical Analysis - Weekly

2018-10-07 - SPX Technical Analysis - Weekly

Longer term, we're going to see whether institutions think it's a good time to add to their positions, or if it's time to reallocate now that they're back to the January high.

Profit taking was the name of the game last week; hopefully you were able to do some of your own. Leading stocks got hammered across the board last week; some were sitting on comfortable gains, others recently broke out and weren't so lucky. Use the market outlook as a guide; right now it's telling us to be cautious. Let price be your guide, and don't forget to set stops and limit your losses if price action is weak.


If you find this research helpful, please tell a friend. If you don't find it helpful, tell an enemy. I share articles and other news of interest via Twitter; you can follow me @investsafely. The weekly market outlook is also posted on Facebook and Linkedin.

You can check out how well (or poorly) the outlook has performed as a stand-alone, signal generator using past performance estimates:

For the detailed Elliott Wave Analysis, go to the ELLIOTT WAVE lives on by Tony Caldaro. Charts provided courtesy of stockcharts.com.


  1. Invest-Safely.com
  2. >>
  3. Tracking the Stock Market
  4. >>
  5. Stock Market Outlook for 2018-10-07

Sunday, September 30, 2018

Weekend Stock Market Outlook

Stock Market Outlook For The Week of
September 30th = Uptrend

INDICATORS

20/50 Day Moving Averages: Uptrend
Price & Volume Action: Uptrend
Objective Elliott Wave Analysis: Uptrend

COMMENTARY

The 3rd quarter comes to a close and we still have an uptrend signal. Hopefully the good times continue through Q4!

With the exception of the Russell 2000, all the major market averages continue to trade above their 20 and 50 day moving averages. The R2K trended lower the entire month of September, which is a bit worrisome considering it's the "small cap" index and small caps tend to lead bull markets.

Price charts for $SPX,$COMPQ,$INDU,$NYA,$RUT,$VIX,$TNX,$USD,$CRB,$GOLD

2018-09-30 - US Stock Market Averages

Some distribution last week, so the level of institutional selling is still elevated. No change in the signal this week, but trading volume and distribution days are another thing to keep your eye on going forward.

OEW remains in an uptrend to start the week. Longer term, OEW sees the current bull market at a turning point, and commentary has started to focus on the next correction. Adding on to last week's comment about caution, Tony says:

    While our target all along has been SPX 3000+ by 2018+, and it still may get there, we’re not one to try and pick the exact top. We scale in when we think a bull market is underway, and scale out when we think it is close to ending.

Moving onto our technical analysis, as expected, the S&P ($SPX) retreating after reaching the upper channel. We start this week closer to the mid-way point, but prices still haven't tested the January high, so look for that level for support if we continue lower this week.

2018-09-30 - $SPX Technical Analysis - Daily

2018-09-30 - SPX Technical Analysis - Daily

The ADX fell last week, putting it back to recent lows. The DI+/- are roughly equal as well. No clear direction from that indicator for this week. The longer-term view remains the same and supports the case for an uptrend; trading volume returning and the January high supporting.

2018-09-30 - $SPX Technical Analysis - Weekly

2018-09-30 - SPX Technical Analysis - Weekly

With Q3 earnings still a few weeks out, I don't see many upside catalysts. In fact, the trade war / tariff chatter may be just the thing to take us down a notch or two (the January high just below 2900 for the S&P or the 50-day) as discussed last week. It's not time to sell the farm, so to speak, but consider trimming winners and taking profits from any trades you initiated back when this uptrend started in March/April.


If you find this research helpful, please tell a friend. If you don't find it helpful, tell an enemy. I share articles and other news of interest via Twitter; you can follow me @investsafely. The weekly market outlook is also posted on Facebook and Linkedin.

You can check out how well (or poorly) the outlook has performed as a stand-alone, signal generator using past performance estimates:

For the detailed Elliott Wave Analysis, go to the ELLIOTT WAVE lives on by Tony Caldaro. Charts provided courtesy of stockcharts.com.


  1. Invest-Safely.com
  2. >>
  3. Tracking the Stock Market
  4. >>
  5. Stock Market Outlook for 2018-09-30

Sunday, September 23, 2018

Weekend Stock Market Outlook

Stock Market Outlook For The Week of
September 23rd = Uptrend

INDICATORS

20/50 Day Moving Averages: Uptrend
Price & Volume Action: Uptrend
Objective Elliott Wave Analysis: Uptrend

COMMENTARY

Another week, another uptrend signal...although this time there are some storm clouds on the horizon that indicate it's time to be cautious.

Most of the indexes start the week above their 20 and 50 day moving averages, but there's a divergence between those averages. The Dow and the NYSE look extended at the moment; they sit well above their 20 day moving averages. On the other hand, the Nasdaq and Russell 2k are struggling to move past that same moving average. Since the Russell 2K and the Nasdaq are home to a majority of growth stocks, the fact that they're lagging industrials and a more "worldwide" index isn't a sign of strength.

Price charts for $SPX,$COMPQ,$INDU,$NYA,$RUT,$VIX,$TNX,$USD,$CRB,$GOLD

2018-09-23 - US Stock Market Averages

The trading environment still looks good from a price/volume perspective (no new distribution days; Friday's option expiration doesn't count). Many leading stocks are testing support levels or have been unable to make much progress after breaking out...another reason to be careful.

OEW remains in an uptrend to start the week. The market averages tracked by OEW ticked a major checkbox last week; all reached new price highs. So they reassessed the situation. No immediate issues to address, but there are some technical indicators that are flashing yellow. (e.g. relative strength, sector strength, # of stocks above their 200 day moving average, etc.). Therefore, OEW feels it's time to get cautious.

By last Friday, the S&P ($SPX) rallied to the upper trendline of the price channel we're tracking, but was again rebuffed. Each time we've reached the upper bound (or nearly reached) since April, we encountered at least a week of selling. The S&P sits 2-3% above the 50 day / lower price channel trendline, so I won't be concerned until we break below that level.

2018-09-23 - $SPX Technical Analysis - Daily

2018-09-23 - SPX Technical Analysis - Daily

The ADX turned up as a result of last week's strength, with bullish price movement in control. But again, the ADX sits well below 20, meaning it isn't providing the most reliable signals; better to stick with momentum indicators for now. The longer-term view remains the same and supports the case for an uptrend; trading volume returning and the January high supporting.

2018-09-23 - $SPX Technical Analysis - Weekly

2018-09-23 - SPX Technical Analysis - Weekly

Based on the above, I expect a sell-off takes us to back to the January high (just below 2900 for the S&P) and wouldn't be surprised if we tested support at the 50-day/lower price channel. That said, you know the saying about opinions, so the best way for you to prepare, participate, and protect is to form your own opinion based on your own investing process and then take action.


If you find this research helpful, please tell a friend. If you don't find it helpful, tell an enemy. I share articles and other news of interest via Twitter; you can follow me @investsafely. The weekly market outlook is also posted on Facebook and Linkedin.

You can check out how well (or poorly) the outlook has performed as a stand-alone, signal generator using past performance estimates:

For the detailed Elliott Wave Analysis, go to the ELLIOTT WAVE lives on by Tony Caldaro. Charts provided courtesy of stockcharts.com.


  1. Invest-Safely.com
  2. >>
  3. Tracking the Stock Market
  4. >>
  5. Stock Market Outlook for 2018-09-23

Sunday, September 16, 2018

Weekend Stock Market Outlook

Stock Market Outlook For The Week of
September 16th = Uptrend

INDICATORS

20/50 Day Moving Averages: Uptrend
Price & Volume Action: Uptrend
Objective Elliott Wave Analysis: Uptrend

COMMENTARY

Looks like the stock market opted for a run at new highs, rather than searching for support. A quick run through a bunch of recession indicators (trends in the yield curve, unemployment, new home sales, retail sales, etc.) shows no sign of a recession with the next 12 months. So even if the markets do test support key support levels sometime soon, it's most likely a buy the dip opportunity.

All the indexes start the week above their 20 and 50 day moving averages; the Nasdaq and NYSE regained the 20 day average last week.

Price charts for $SPX,$COMPQ,$INDU,$NYA,$RUT,$VIX,$TNX,$USD,$CRB,$GOLD

2018-09-16 - US Stock Market Averages

A solid week of gains on rising trading volume last week; not quite as much volume as expected, but we're in a positive position nonetheless.

OEW is still in an uptrend, and still expecting new highs in all market averages before any kind of next major correction.

2018-09-16 - $SPX Technical Analysis - Daily

2018-09-16 - SPX Technical Analysis - Daily

The S&P ($SPX) starts the week in a good position; fresh off a key support level and in the middle of our price channel. Tell me if you've heard this one before: the ADX is showing a weak trend. At least the directional indicators are supporting of an uptrend (DI+ is greater than DI-). One of these days I'll need to find a momentum indicator to supplement the ADX.

2018-09-16 - $SPX Technical Analysis - Weekly

2018-09-16 - SPX Technical Analysis - Weekly

Extending our view, we see the expected increase in trading volume, and the January high acting as a support level last week.

And since we've successfully recovered the January high, it's a good time to check your asset allocation levels and/or take some profits. Remember: bulls make money, bears make money, pigs get slaughtered.


If you find this research helpful, please tell a friend. If you don't find it helpful, tell an enemy. I share articles and other news of interest via Twitter; you can follow me @investsafely. The weekly market outlook is also posted on Facebook and Linkedin.

You can check out how well (or poorly) the outlook has performed as a stand-alone, signal generator using past performance estimates:

For the detailed Elliott Wave Analysis, go to the ELLIOTT WAVE lives on by Tony Caldaro. Charts provided courtesy of stockcharts.com.


  1. Invest-Safely.com
  2. Tracking the Stock Market
  3. Stock Market Outlook for 2018-09-16